Many traders spend too much time looking for the
best possible entry. However, the entry can be based on any number of
technical indicators. For traders who are a fan of price-action, you
could do no worse than finding triggers based on a fractal breakout in
the direction of the trend.
Fractals Defined

Let’s start with an introduction to fractals. The
actually are applied to trading from nature and not the other way
around. It may be helpful to know that fractals are effectively a way of
looking a sub-sets of large pieces of data to understand what
developments are being created in real-time. From a trading / market
perspective, fractals are an indicator highlighting the chart’s local highs and lows where the price movement reversed marking a 5-bar high or low. These reversal points are called respectively Fractal highs and lows.
Learn Forex: The Hand is a Perfect Fractal

Before we take this natural reoccurrence to the
market, you should see how your hand, with fingers pointing up is the
perfect up fractal and with your palm facing you, is a perfect down
fractal. A
Market swing Fractal shows a price extreme in the middle of 5 bars
whereas an up fractal has the middle bar with a highest high in the
middle with two lower highs on the left and two lower highs on the
right. A down fractal will have a low price
extreme in the middle bar of a 5-bar sequence with the higher lows on
the left and two higher lows on the right.
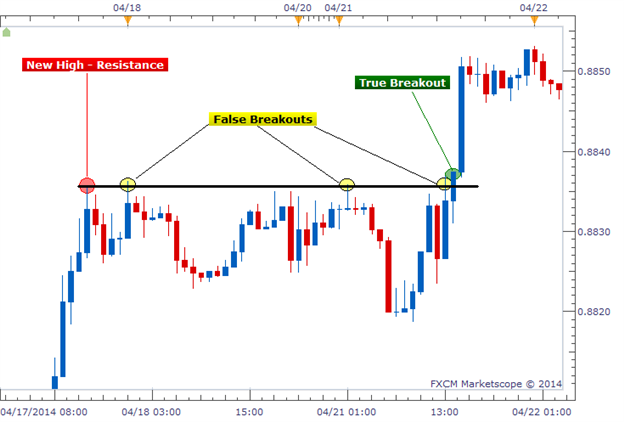
How Traders Can Use Fractals
Volatility
is a key determinant to trading opportunities. One of the common
triggers that volatility is in play is when a prior high or low is taken
out and a new trend begins. Fractals can be applied to the chart so
that you can see when a recent key level has broken which can lead to a
price-action trading opportunity.
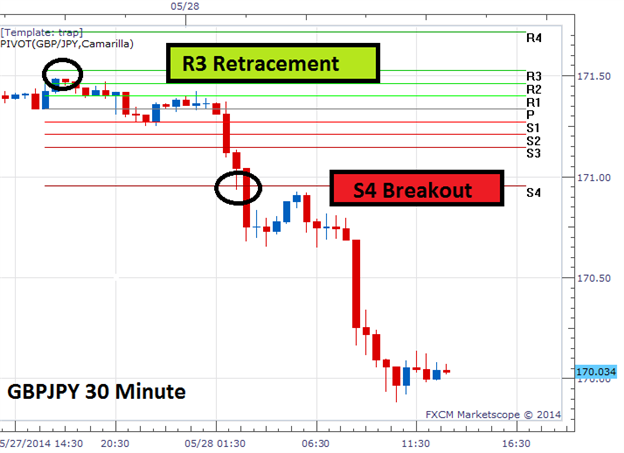
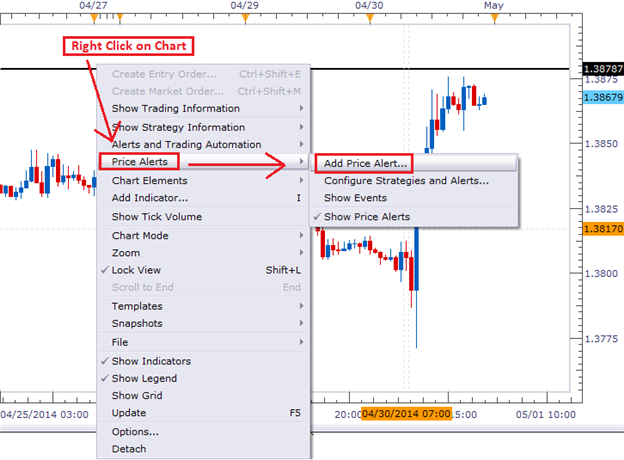
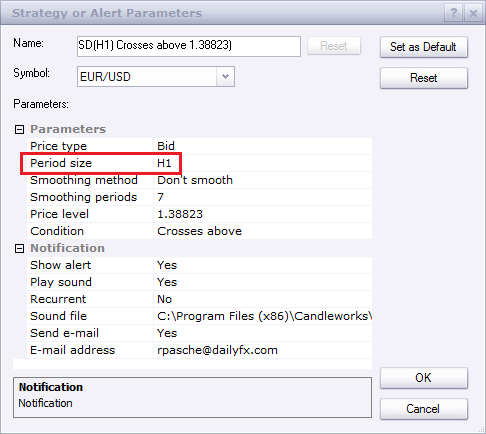
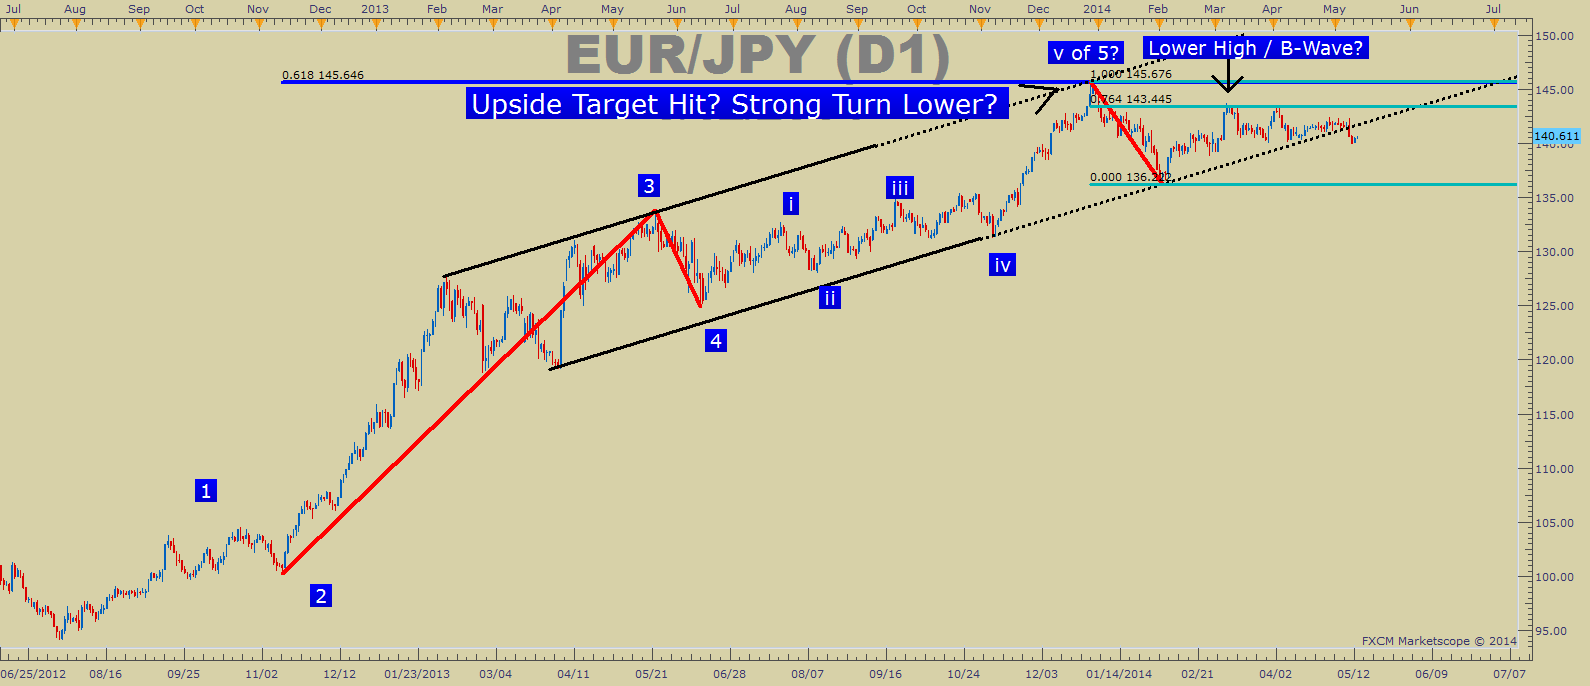
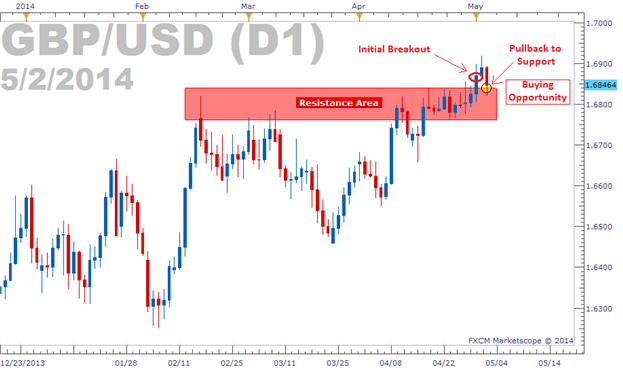
Learn Forex: Pinpoint Key Price Action Swings With Fractals
Presented by FXCM’s Marketscope Charts
Fractals revolve around price action highs and lows
and can easily pinpoint places for a breakout entry or tight price
action based stop.
Fractals can be used in a variety of ways. Most
commonly, traders will look for a bar to close above a prior up fractal
to show an upside breakout or a close below a prior down fractal to
signal a downside breakout that is potentially worth trading. Another
positive aspect is that when you have a comfortable view of a strong
trend in play, you can use fractals as a trailing stop from a prior
counter-trend move which made a fractal.
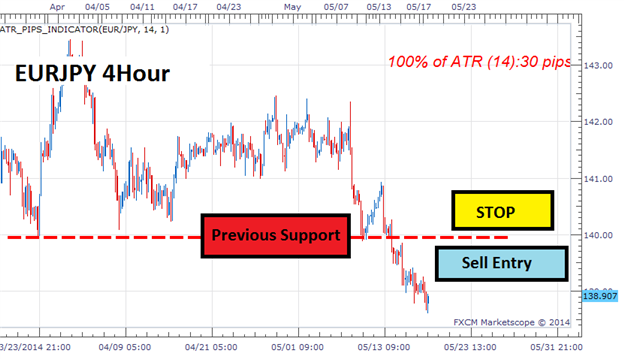
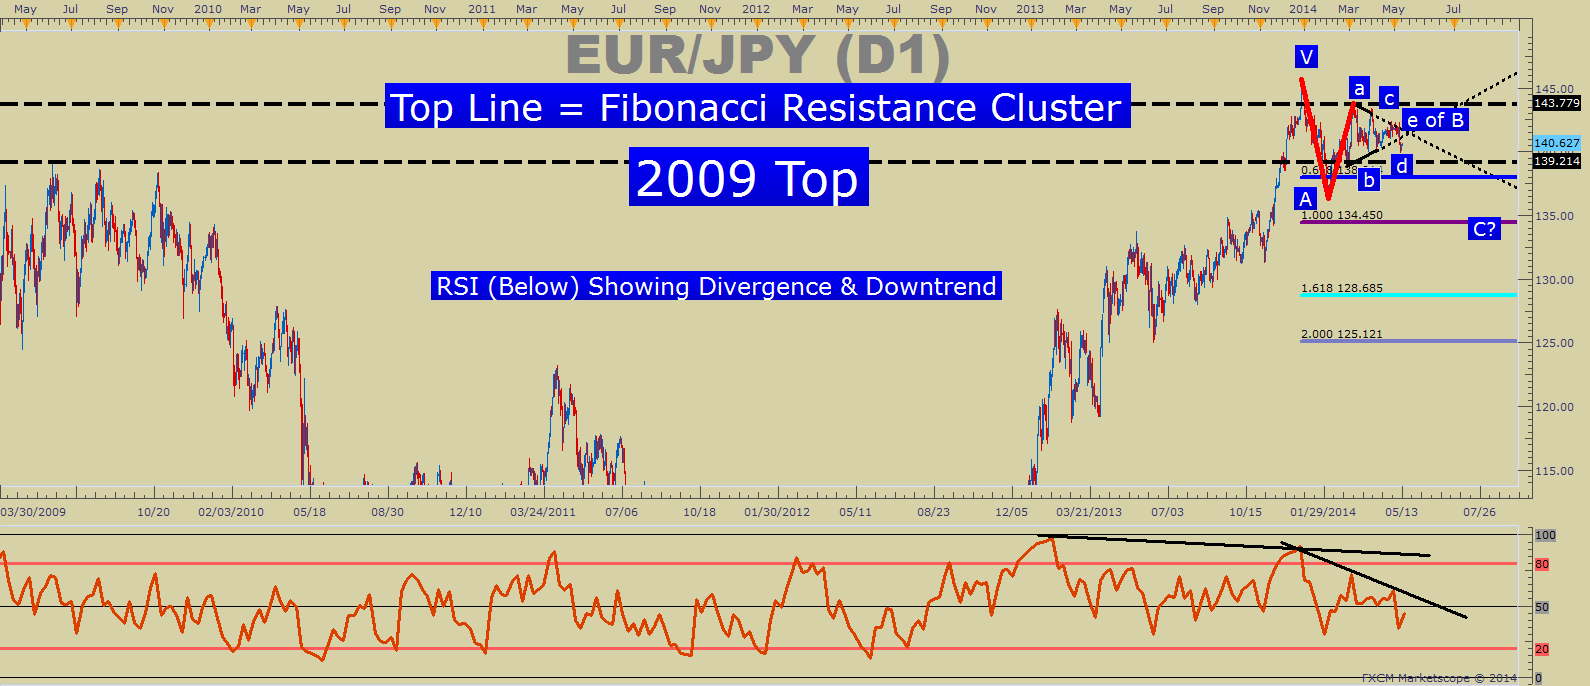
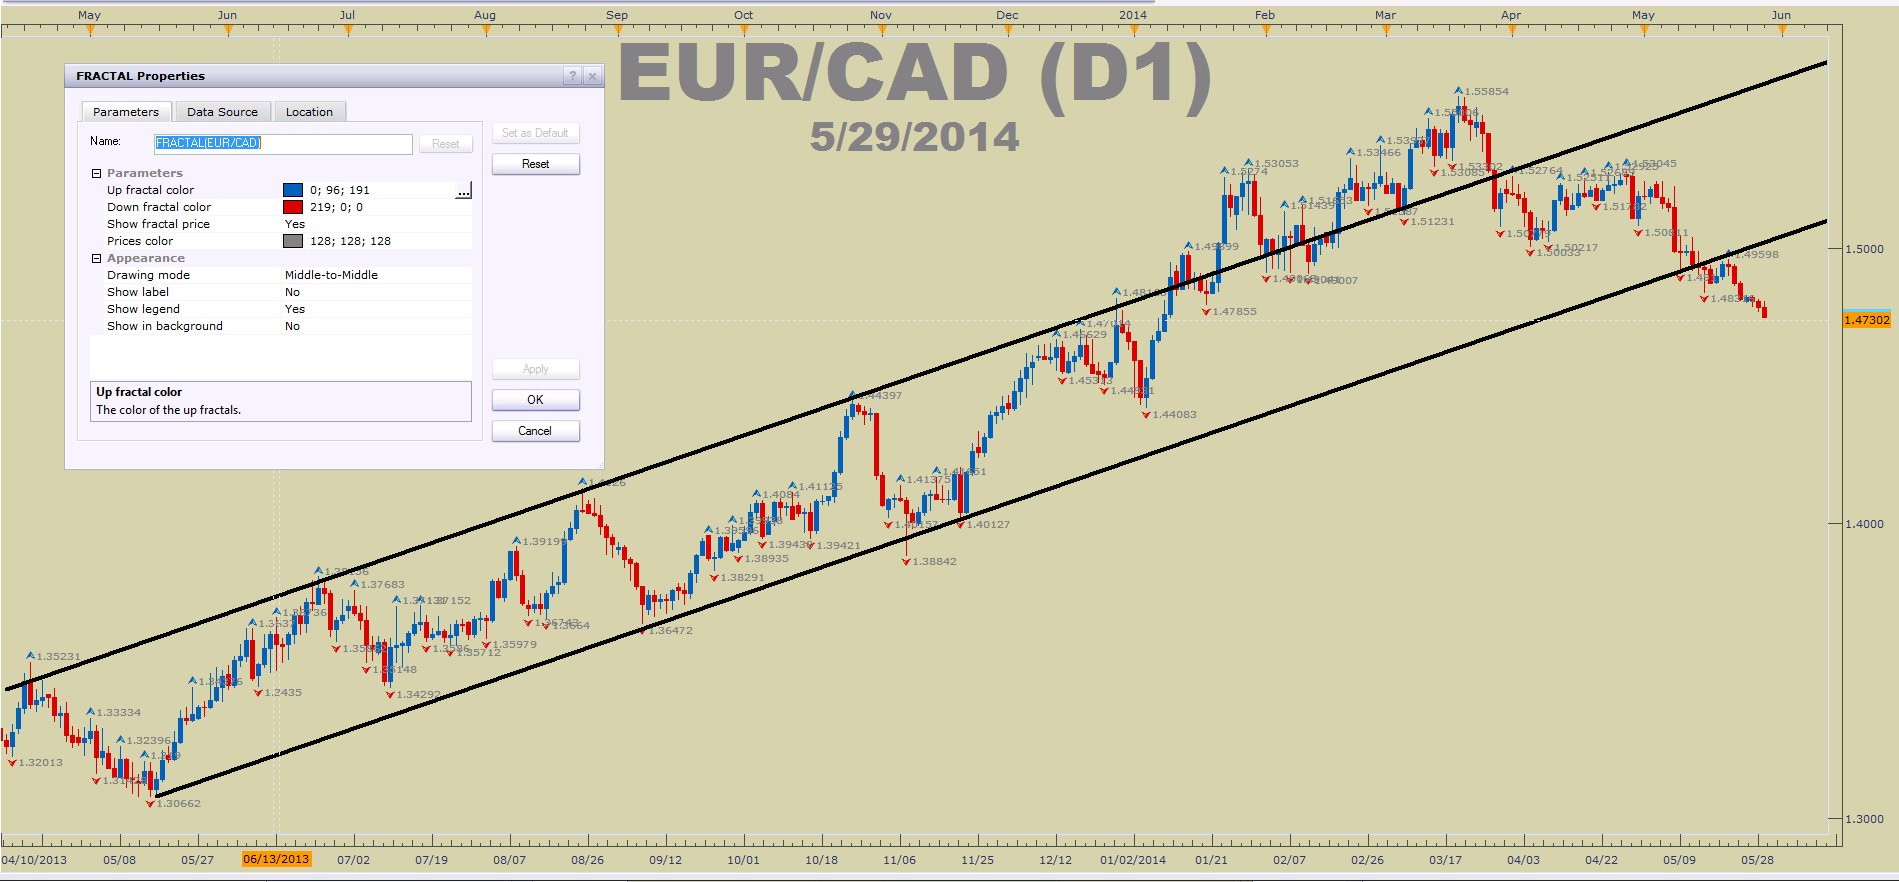
Learn Forex: USDOLLAR down Fractals Have Been Stair Stepping Higher since Recent Reversal
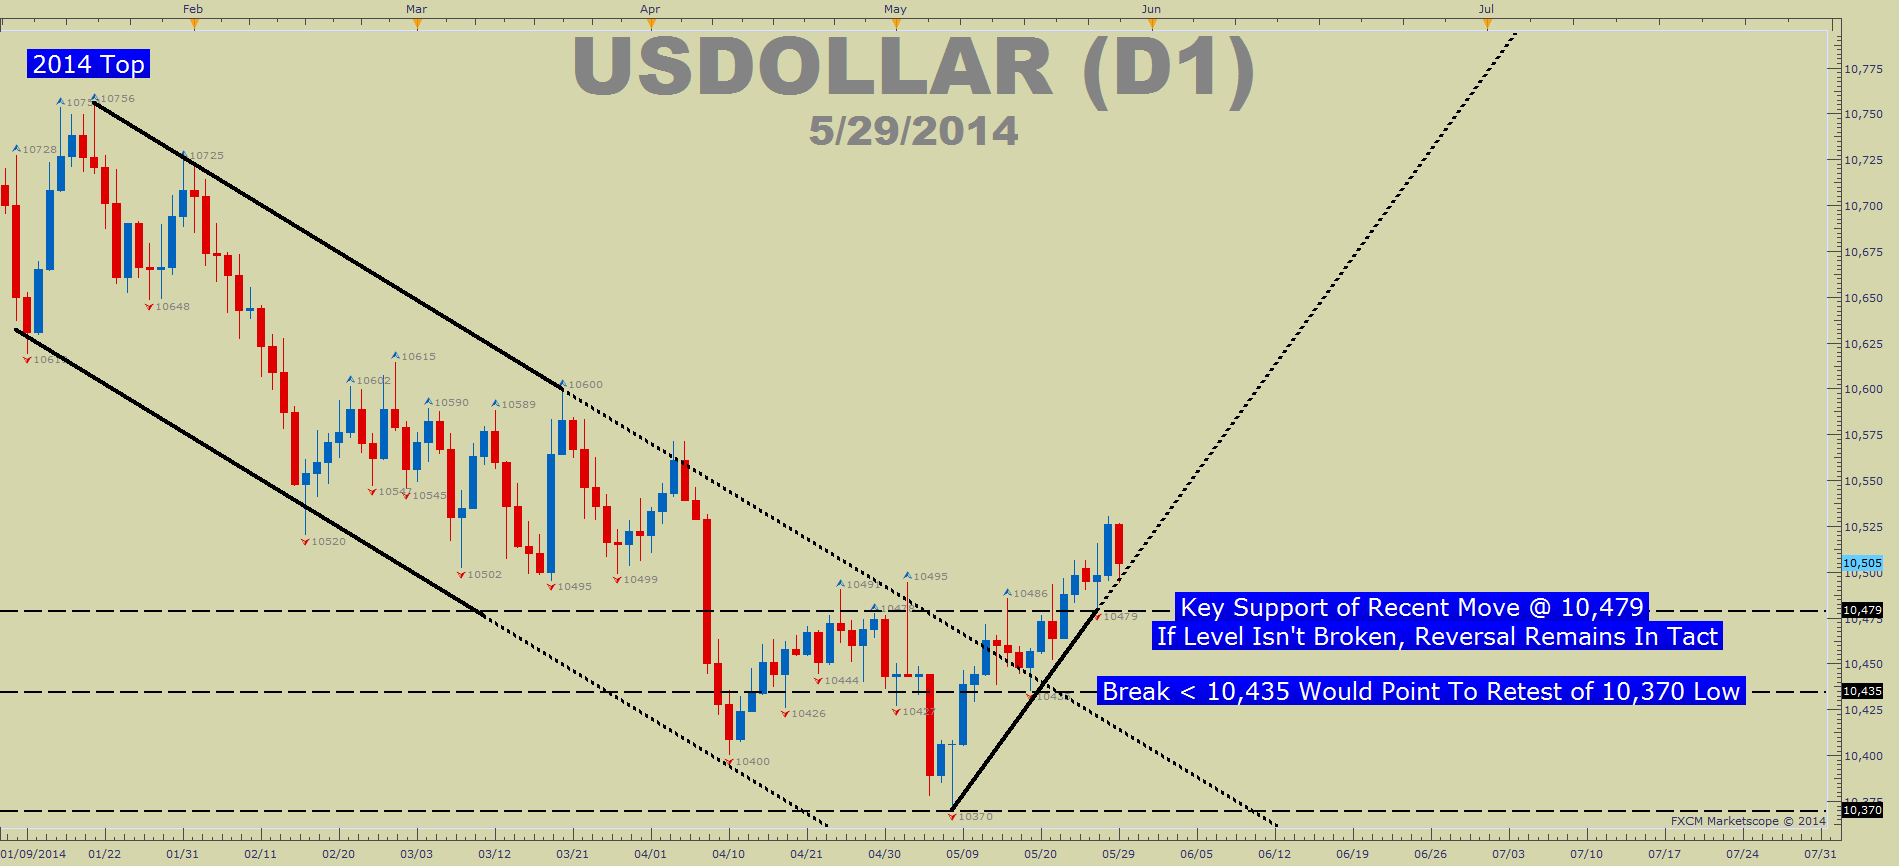
Presented by FXCM’s Marketscope Charts
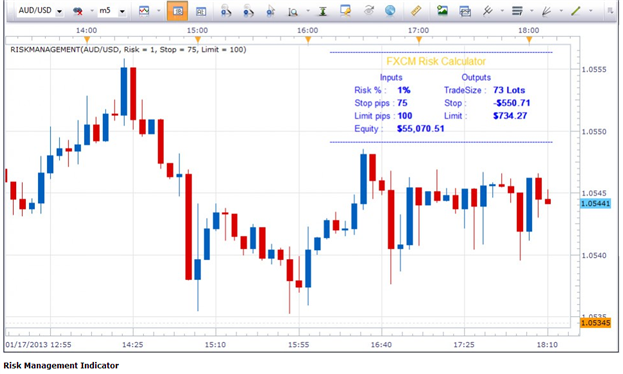
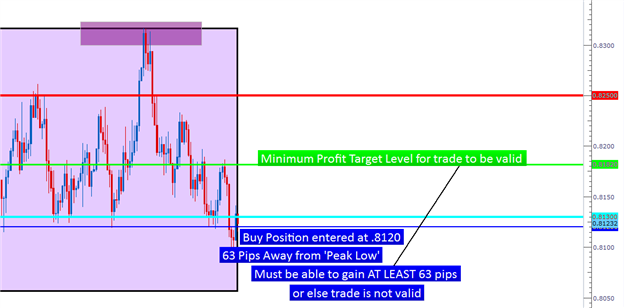
Real-Time Fractal Set-Up
For purpose of review,
fractals mark price changes or pivots in the market. For reasons known
or unknown, they are reaction points that can help you spot key places
to place an entry order
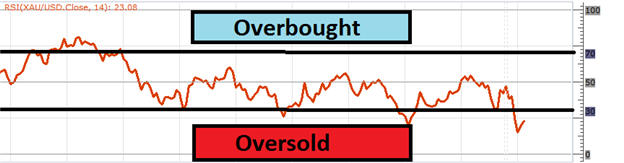
or stop. From a trader’s stand-point, they allow you to enter on a
confirming view of your analysis vs. a hunch that a market is oversold
or overbought and is time to enter like this trade set-up on the Australian Dollar.
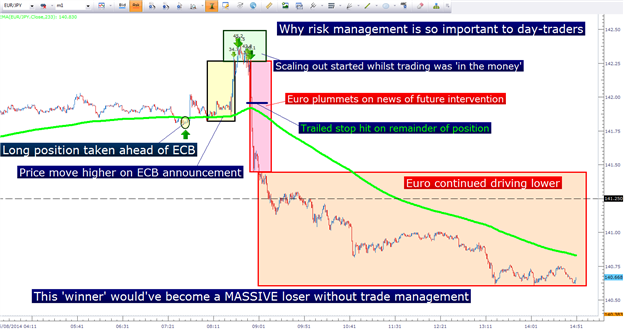
Learn Forex: A Fractal Based Entry on AUDUSD
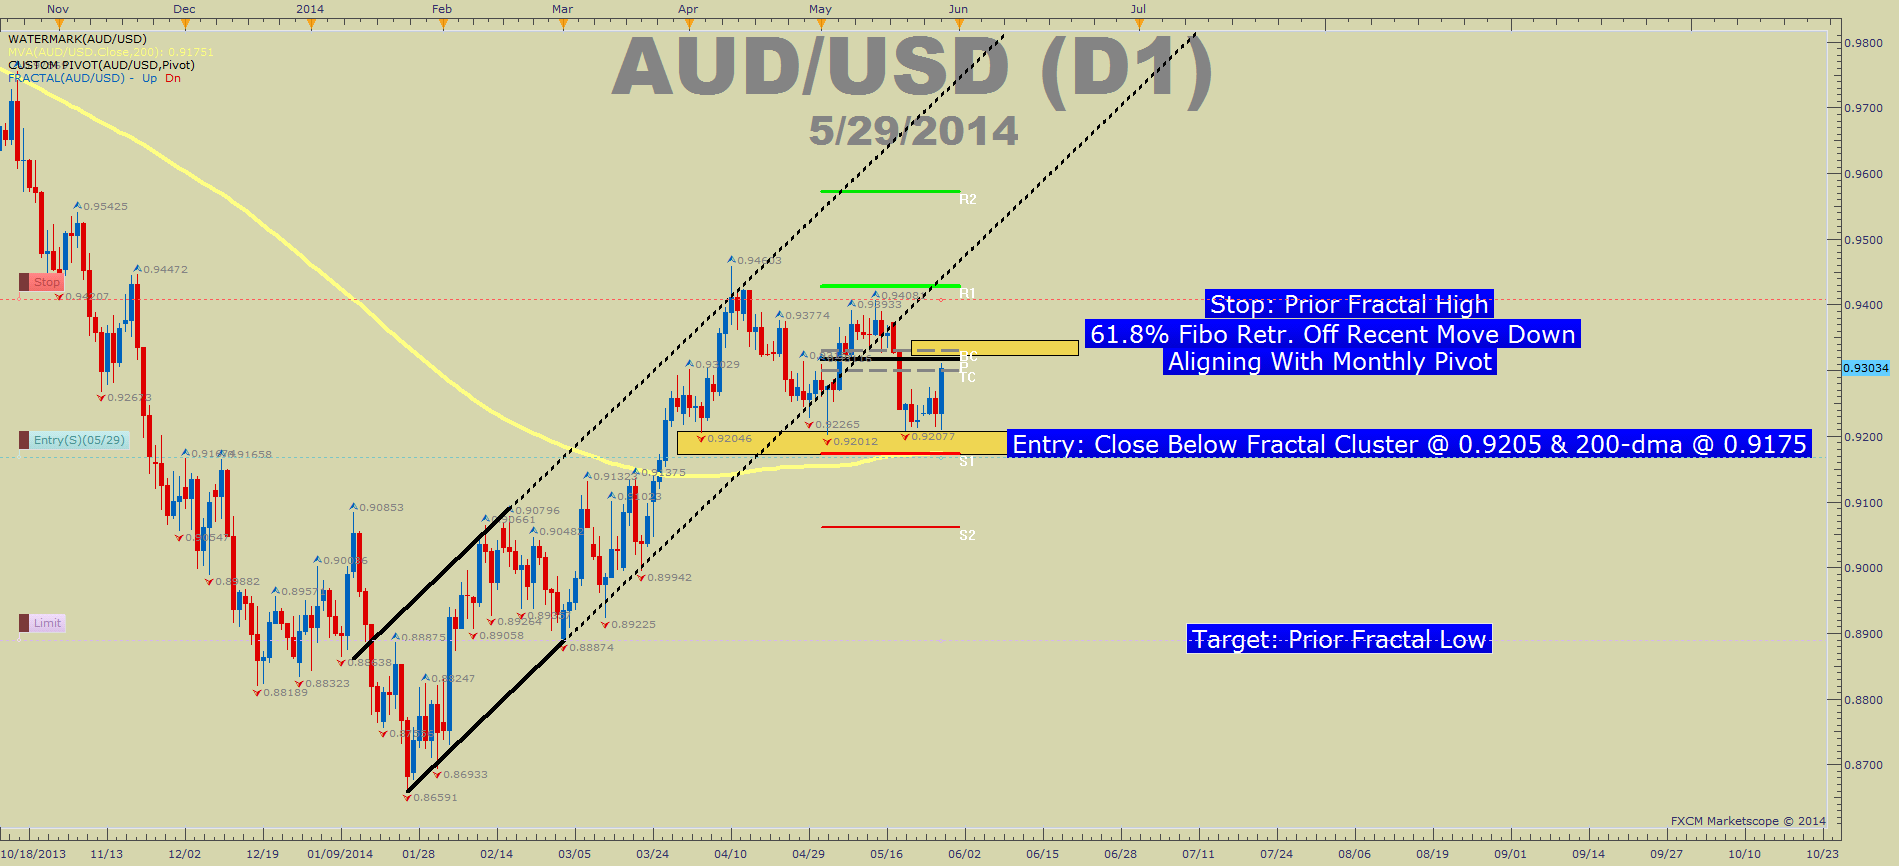
Presented by FXCM’s Marketscope Charts
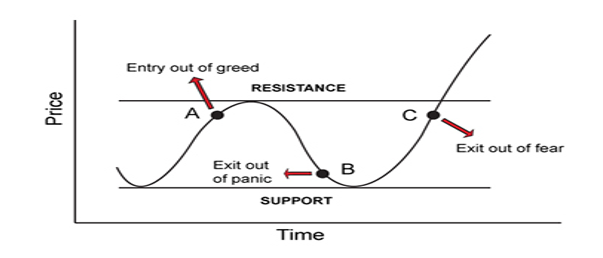
Every trader should embrace the following seven words:
I don’t know what will happen next
This isn’t meant to disregard your analysis but tell
a simple fact about trading. Anything can happen in the market place
and an infinite number of possibilities are plausible. As a trader, we
can develop a strategy with set rules that work with our psychology to
give us an edge but it will not predict the future. Therefore, we can
use fractals as a trigger to put us into a trade or out of a trade and
we may not know if the trade will end in a profit but we can now that
we’re only acting on objective evidence.