Monday, April 28, 2014

Why Traders Lose Money

While the title of this article can have broad implications with numerous explanations, we’re going to do our best to reduce the answer to this query to the most logical and basic explanation.
When a trader first gets started, it might be hard to imagine how getting control of losses can seem an impossible task. It may even feel like the cards are stacked against you… situations in which you’re right in your analysis, yet you still lose on the trade and watch capital disappear from your trading account.
So, a natural question is why some traders consistently make money while others lose, even when they’re right. That is what we will be investigating in this article.
The Difference between Trading and Analysis
Many new traders come to the market with a bias or point-of-view. Perhaps this is built from a background in economics, or finance, or maybe just a keen interest in politics. But one of the biggest mistakes a trader can make is harboring the expectation that ‘the market is wrong and prices have to come back.’
But let’s face it: Markets are unpredictable, and it doesn’t matter what type of analysis you use. As new information comes into the market, traders and market makers price it accordingly; because these folks don’t want to lose money just as much as you don’t want to lose money.
Is this to say that analysis is worthless? Absolutely not: It merely means that analysis is only a part of the equation of being a successful trader. Analysis is a way to potentially get the probabilities on the trader’s side, even if just a by a little bit; a way to maybe get a 51% or 52% chance of success as opposed to a straight-up coin flip.
Good analysis, whether it be fundamentally-driven or technically-driven, can be right a majority of the time. But no form of analysis will ever be right all of the time. And this is the reason that there is such a large chasm between analysis and trading.
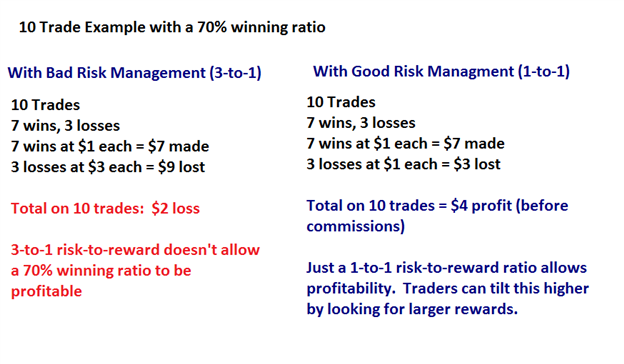
In analysis, it doesn’t matter how wrong you are when you aren’t right. In trading, this matters quite a bit. Because even if you’re winning on 70% of your trades, if you’re losing $3 for every trade in which you’re wrong but only making $1 every time that you’re right, you’re still losing. It might feel good, because 70% of the time you’re walking away from your positions with the feeling of success; and as human beings this is something we generally strive for (to feel good).
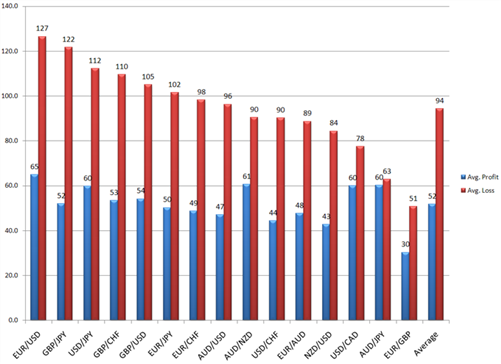
The example below shows how bad risk management can destroy even a strong winning percentage of 70% success.
Why Traders Lose Money
But logically, it doesn’t make sense to embark on this type of endeavor because the goal of trading is to make money; not necessarily to just ‘be right’ more than 50% of the time.
How to actually trade analysis
First thing first, traders need to crystallize what their actual goal is in trading in markets; and point-blank, that goal should be to make money.
After that, traders need to expect that they will, at times, be wrong.
So given these two facts, the next logical assumption is that without being able to control the damage from those instances in which we’re wrong, the prospect of profitability is a distant one.
So risk management isn’t just a preference or a style of trading: It’s a necessity for long-term profitability. Because even if you’re winning 90% of the time, the losses on the other 10% can far outstrip the gains that are made on the 90%.
I fully realize this isn’t necessarily exciting information. When I teach risk management, rarely do a see a student-trader ready to burst out of their seats to go and manage some risk. Most people want to hear about entry strategies, and analytical methods to try to get those odds of success tilted even higher in their favors.
But until a trader learns to manage their risk, much of this additional work is a moot point. Because as long as the risk exists that one bad position can and will wipe away the gain from many other ‘good’ positions; that trader is going to struggle to find profitability.
So, to properly trade analysis one needs to first observe proper risk management. Because trading isn’t just ‘guessing’ and ‘hoping’ that we get it right. Profitable trading is implementing analysis while properly managing risk factors; implementing a defensive approach so that when one is wrong, the losses can be mitigated and when one is right, profits can be maximized.
How can one begin to use ‘proper’ risk management?
We’ve already encountered one of the biggest mistakes of risk management, and that’s controlling the size of the losses relative to the size of the gains.
This was listed as The Number One Mistake that Forex Traders Make, and in the article The Top Trading Mistake, we looked at exactly how this problem can be so utterly damaging to new traders.
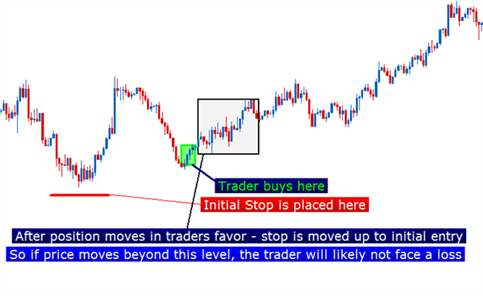
The solution is simple; implementing it not as much. As human beings, we often follow our gut instincts or our ‘feelings.’ But in trading, we have to keep the bigger picture in mind. When we place a trade, we often try to win on that one trade. This can keep traders holding on to losers for far too long, and closing out winners way too quickly.
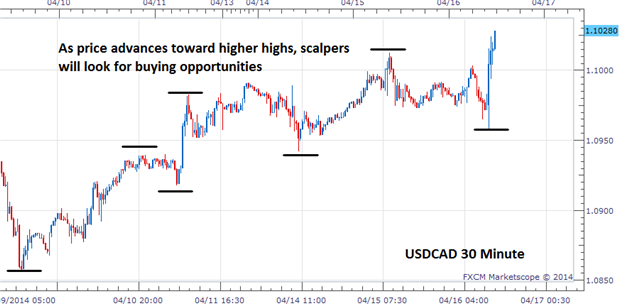
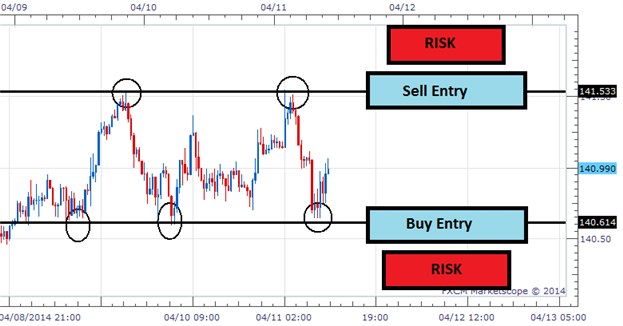
Traders can adjust strategies to focus on lower-risk, higher reward types of setups
Why Traders Lose Money
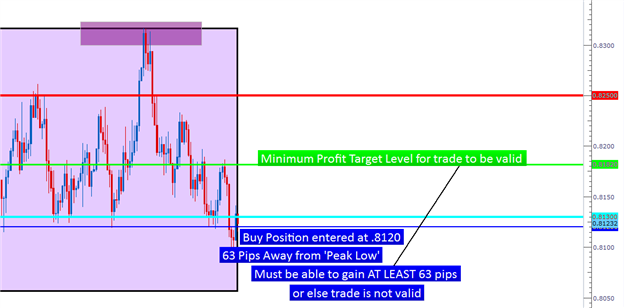
Image taken from How to Identify Positive Risk-Reward Ratios with Price Action; by James Stanley
The way to fix the Top Trading Mistake is to simply look to make more when you’re right than you lose when you’re wrong. That’s it. This can be done by setting stops and limits on every trade that is placed to reinforce that minimum 1-to-1 risk-to-reward ratio.
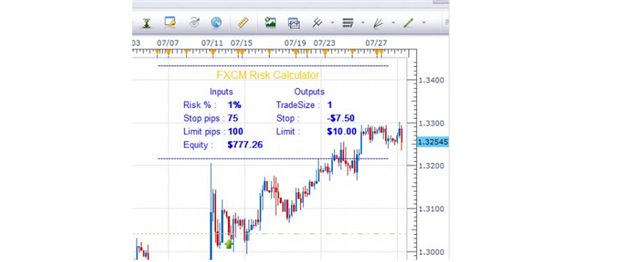
Unfortunately, risk management isn’t as simple as just setting a stop and setting a limit. After all, if a trader takes on a position that’s way too large relative to the size of their account, even if using a 1-to-2 or 1-to-3 risk to reward ratio; that one trade could completely wipe them out.
This is similar to the advice of ‘not putting all of your eggs in one basket.’ And while this concept is simple for equity investors that have seen stock prices fall off-of-a-cliff, highlighting the fact that investing in just one stock can be so dangerous, traders should look at the art of speculation in a similar light.
We discussed this topic in the article, Top Trading Mistakes, Part II: The impact of larger amounts of leverage. Not only does high leverage bring on a higher potential for failure, but highly-leveraged trades also amplify The Number One Mistake Forex Traders Make because more leverage amounts to even bigger swings in account equity.
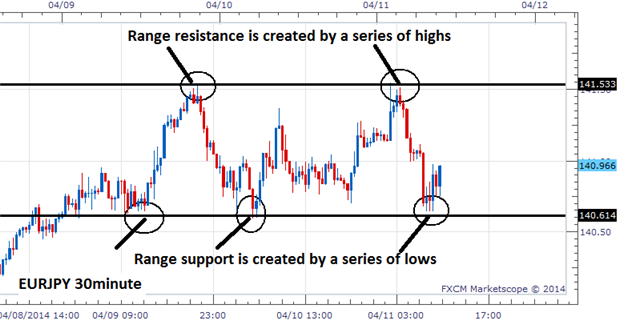
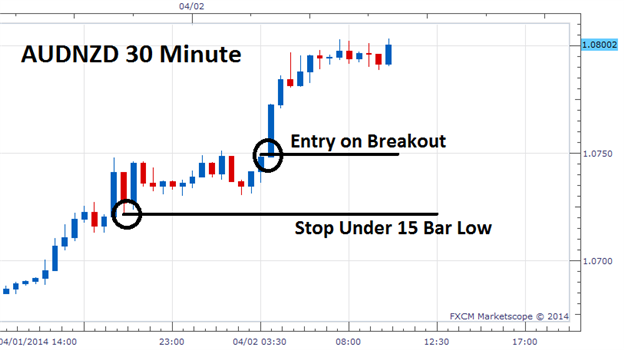
We finished off the Top Trading Mistakes series with the third article, and this comes down to strategy selection. Even if a trader goes out of their way to prevent the top two trading mistakes, it doesn’t guarantee success. Holy Grail strategies don’t exist, and the best that a trader can do is to look to employ an approach befitting of that particular market’s condition.
If you’d like an example of how this can be done, the article How to Catch Swings in the Forex Marketshowed how traders can look to trade short-term reversals or swings with a constant eye on risk management.

Tuesday, April 22, 2014

2 Ways to Trade a 2500 Pip Trend, Part 2: Fear of the Unknown

This is the second part of a 2 part series on trading strong trends. The first part was devoted to using a retracement strategy on the EURNZD which has been in a strong down trend for the past 11 months. Yesterday, prices did push into the resistance retracement zone. Therefore, retracement traders may be inclined to enter a position based on selling at resistance.
However, in our DailyFX Plus webinars, we frequently hear from traders who are apprehensive to place entries into the market because they fear the unknown price movements into the future. What if the strong trend ends?
That is a common emotion felt by many traders. Utilizing a break out strategy can help alleviate some of those pressures as you let the market dictate to you if it is ready to resume the trend.
A breakout is simply selling at support and buying at resistance. There are many different ways of determining support and resistance. Today, we will look at a simple method of identifying entry and exit points by using the Donchian Channel Indicator.
 
2_Ways_to_Trade_a_2500_Pip_Trend_part_2_body_Picture_1.png, 2 Ways to Trade a 2500 Pip Trend, Part 2: Fear of the Unknown
(Created using FXCM’s Marketscope 2.0 charts)
 
Here is a summary of the rules to the strategy.
  1. Filter your trades in the direction of the daily trend. We determined in Monday’s report that this trend is a strong one to the downside. Therefore, we will look to sell.
  2. Add the Donchian Channel Indicator to a 2 hour chart. Input value is 55 periods.
  3. Place an entry order to sell 1 pip below the lower Donchian channel.
  4. Place a stop loss order at the upper Donchian channel. Manually trail your stop loss so that it follows the upper channel.
  5. Exit the trade when price reaches the upper Donchian channel.
The benefit of using this strategy is that if the trend re-emerges to the down side, the market trips the entry and places you in the trade. By trading to a new low, the market is essentially stating it is ready to trade to levels not seen in quite a while. In the case of the EURNZD, it would be trading at all-time lows and therefore, furthers the case that it is in a strong trend.
Also, another benefit of a breakout strategy is that it can keep you out of some losing trades (“Breakouts: How to Stay Away from Some Losing Trades”). So there are several advantages to implementing a breakout type of strategy. The downside to the strategy is that you are entering a sell trade at a lower price and therefore, entering the trade late.
In closing, when you find yourself facing the fear of the unknown in a strong trend, consider implementing a breakout strategy. Inside DailyFX Plus LIVE CLASSROOM, we frequently discuss breakouts and how to trade them.

Monday, April 21, 2014

2 Reasons to Sell US DOLLAR

TheDow Jones-FXCM U.S. Dollar Index (Ticker: USDollar), has been quietly putting in a series of lower highs and lower lows for the past four months. Though this downtrend has been in force for a while, we believe there is still one more opportunity to sell the Greenback with a good risk to reward ratio.
Here are two technical reasons the USDOLLAR may continue to slide.
 
SSI Shows Retail Traders are Currency Buying USD
FXCM’s Speculative Sentiment Index (SSI) is a sentiment reading much like the COT report in futures trading or the Put/Call ratio in equity trading. SSI is a good contrarian indicator such that when a large number of traders are already positioned in a pair to one side of the trade AND if they are trading against the trend, more often, they end up being wrong on the trade.
In this case, traders are significantly positioned as US Dollar buyers. Since the trend has been towards USD weakness, these traders are fighting the trend. SSI is giving us a broad based signal that USD weakness is likely to continue.
2 Reasons to Sell USDOLLAR
Taken from FXCM’s SSI reading April 21, 2014
 
In the chart above, you’ll see how traders are positioned for Greenback strength in all of the majors, except the AUDUSD. For example, the EUR/USD shows a ratio of -2.99. This means there are nearly 3 traders short the EUR/USD for every trader who is long.
With this much broad sentiment based towards US Dollar strength, the contrarian reading suggests the US Dollar is likely to continue getting weaker.
(See FXCM’s SSI readings twice per day inside DailyFX Plus with your live account username and password. If you don’t have a live FXCM account, then you can subscribe monthly.)
 
Using Wave Relationship to Guide our Trade
The second technical reason to sell the Dollar is based on Elliott Wave analysis.
When looking at the waves of the USDOLLAR chart, prices have aggressively sold off in late March and early April 2014. It is possible that those moves down were waves 1 and 3 of a five wave sequence. If this is the pattern, then we are currently in a wave 4 counter trend retracement higher which will eventually give way to a fifth and final wave lower.
Elliott wave is a challenging type of technical analysis. Though it is difficult to learn, the benefits of even understanding it at a basic level can help you identify points on the chart to place a stop loss and take profits.
 
Forex Education: Completing the 4th wave of a 5 wave sequence
2 Reasons to Sell USDOLLAR
(Created using FXCM’s Marketscope 2.0 charts)
 
One of the rules in Elliott Wave is that wave 4 cannot enter into the territory of wave 1 in a five wave impulsive move.
If the labeling on the chart above is correct, then that means that wave 4 would not enter into the low from March 27 (see purple dotted line). If it does, then the labeling on this chart is incorrect and some other pattern is developing.
We can also use wave relationships to identify if we are getting close to an ideal entry point.
In a three wave corrective move (see the dark blue a-b-c labels above), wave c oftentimes has a length relationship to wave a. As we can see above, the orange horizontal lines illustrates where the length of wave c is 61.8% the length of wave a, a common relationship.
Also, a typical stopping point for wave 4 is at a 38.2% retracement of wave 3. Adding our Fibonacci retracement levels to the chart, we see that the 38.2% retracement of wave 3 is near 10,466.
As you can see, both the orange and blue lines are VERY close to one another. This strong wave relationship is part of the reason why prices are having a hard time moving higher.

Another wave relationship guideline is that wave 5 tends to have a wave relationship with wave 1 in terms of equality. Said another way, the size of wave 5 tends to equal the length of wave 1. That would mean wave 5 would modestly surpass the end of wave 3 and fall into the 10,375-10,400 zone.
Since this is the pattern we are favoring right now, we can enter the trade with a stop loss 1 pip above the low of March 27 (the low of wave 1). That means the stop loss on the trade would be placed at 10,500.
If we enter near the current market price and look to take profits near 10,400, that means our trading opportunity would have a 1:2 risk-to-reward ratio.
For those account holders who reside outside of the United States, you can place this trade through the USDOLLAR instrument. You should be able to see this appear on your platform.
For residents inside the United States, you can place a basket trade. There are several benefits to trading a currency rather than a pair. The Mirror platform allows you to place a US Dollar Sell Basket with one click. You can register for a free Mirror practice account if you would like to try it out.

Saturday, April 19, 2014

How to Match Your Personality with Your Forex Trading Strategy

If you’re having trouble sticking to your forex strategy, then you might need to figure out if your personality matches your trading style. In his book, “Mechanical Trading Systems: Pairing Trader Psychology with Technical Analysis,” author Richard Weissman identifies three basic trader personality profiles: trend-following, mean-reversion, and day-trading types.


Are you a trend-following trader?

Weissman enumerates two traits necessary for successful trend-followers: patience and fortitude. Trend-following mechanical systems attempt to catch strong directional moves, with signals forming when the trend has already begun. A typical entry strategy may be to buy at recent highs or sell at recent lows, in anticipation that the price will make a new high or low later on. This may seem counter-intuitive to the majority of traders who like to pick “tops” and “bottoms,” but that’s what sets trend-followers apart from the rest.

The strength of this method is that if you catch a strong trend, you can come up with huge winning trades relative to your initial risk. But of course, no system is fool proof and there are tradeoffs to grabbing potentially big wins.

As the saying goes, “markets range 70-80% of the time.” That means catching a strong trend can be rare, and sticking to a trend-following system requires that you endure several small losses when your entry signals have you jumping in when the market consolidates or pulls back.

To be a trend-following trader you must be comfortable with potentially having a low win ratio, but as long as your winning trades generate enough profits to outpace your losses, then that’s all that matters.

So the questions you have to ask yourself are: Do I have the mental fortitude to handle more losses than wins? Do have the patience to ride the winning trades to their full profit potential? If you answered “yes” to both questions or if you feel stressed having to come up with numerous trade decisions in a day, then trend-following mechanical systems may be the right entry/exit method for you.

Are you a mean reversion trader?

In terms of price action, the mean reversion theory states that on average, markets are more often trading within a range than trend. When the market goes beyond its average range of historical volatility, it tends to fall back to the middle of that range, or the “mean.” These systems aim to look for probable reversal points (i.e. tops and bottoms) where price movement could change direction.

The major difference is that while trend following systems aim to “ride the trend” for large profits, mean reversion systems normally have an exit in mind based off key support or resistance levels. This means a lot more smaller winning trades.

A couple of indicators used in mean reversion systems are the ADX and Stochastic. The ADX helps identify whether the market is in a trend or rangebound, while the Stochastic indicates potential overbought and oversold conditions that tend to precede a reversal.

The key to utilizing a mean reversion system, especially during the long-term timeframes, is maintaining rock solid discipline. Using this method could put you in the market against a strong trend, which can be psychologically difficult if it doesn’t turn your way. Also, there can be many distractions and obstacles that cause psychological stress for a trader, such as the media and other traders. You must train yourself to follow your system’s rules no matter what and remember that the strength of a mean reversion system is the high probability that markets will stay in a range.

Are you a day trader?

Lastly, we have day trading systems. These can be trending or mean reversion systems, but on a shorter time frame–Weissman cites that these generate signals for trades that last 10 days or less. Market junkies who have a knack for these kinds of fast-paced systems usually look at the hourly time frame or lower to aim for smaller profits and place tight stop losses.

According to Weissman, mechanical systems benefit short-term traders the most as the frequency of making trade decisions arise. By using a mechanical system that already outlines what entry and exit levels to take with pre-determined risk-reward ratios, a day trader is somehow relieved from stress.

However, this is not to say that intraday systems are all sugar, spice, and everything nice. The biggest drawdown to using them is that they are labor-intensive. Traders have to be glued to their screens during trading hours either to be ready to act on valid signals or to monitor/adjust their trades.

Dealing with potentially volatile intraday market action, a trader must be able to quickly make sound decisions. Mental agility is critical for someone to master day trading systems and if you think that you have the capacity to find Zen amid the chaos, you may want to try out an intraday system.

So what’s your trading personality?

You have to remember that regardless of what kind of system you’re using, the market will always find a way to put you between a rock and a hard place. There will be times that you will have more losers than winners, trades go quickly against you, or you’ll have to let go of some of your unrealized profits, but knowing what you are comfortable with and finding the system or method that matches your personality will help you better adapt to the always-changing market environment.

Check out our trading personality quizzes (No, we did not pull these off Cosmo! Only Big Pippin reads that, but don’t tell him I told you his little secret!) to figure out if your personality matches your trading strategy.

Friday, April 18, 2014

How Oscillators Can Show You If You’re Trading Against The Trend

Oscillators can be one of the most valuable tools in a trader’s arsenal. A big reason for its value is that very few tools can help you see a great risk: reward set-up when a price action correction is coming to an end. Put in other words, an oscillator helps you see the exhaustion of a move so that you can enter near the exhaustion point of a prior trend.
However, it would be a disservice to you if you were led to believe that a stretched oscillator was a great entry. Unfortunately, after many new traders learn about the benefits of oscillators, they believe they’ve received the golden key to trading profits and start buying low and selling high. A few steps back from the chart though and you’ll quickly see that only side of the trade is worth taking based on how price action reacts to an unwinding oscillator. 
 
Learn Forex: Trading With the Trend Is Always Preferable
Trading-Trends-With-Oscillators_body_Picture_3.png, How Oscillators Can Show You If You’re Trading Against The Trend
Courtesy of Marketscope 2.0
 
The Pain of Trading Against the Trend
The problem with trading against the trend is that it works every now and then. However, as a trader, it’s easy to agree with the words of John Maynard Keynes who said, “Markets can stay irrational longer than you can say solvent.” This sounds like someone who thought they had sold the top only to find they entered against a very strong trend that has no intention in stopping soon.
From talking to thousands of trader’s over the years, I’ve recognized a handful of reasons for trading against the trend. While this is not a definitive list, I’ve seen these three play out over and over again:
  • The excitement of being right while everyone else is wrong
  • The thought that the trend is overbought and due for a deep set-back
  • The feeling that the biggest money will be made on the big turn
It’s not wrong to feel this way. However, for most, it’s not profitable to trade this way and they’re falling prey to mental biases as opposed to good analysis. The reason that countertrend trading can be unprofitable for many to trade is because if you enter emotionally, you often exit emotionally. Exiting emotionally is a nice way of saying that you exit after a lot of your capital has been eaten up on a bad trade from the start. 
 
How Price Action & Oscillators Behave Counter-Trend
As you can see from the chart above, the oscillator often moved from extreme high to extreme low. Extreme lows are usually anything below 20 and extreme highs are usually anything over 80. Extreme highs are deemed to be overbought markets ready for a turn lower and extreme lows are deemed to be oversold and due for a bounce higher. 
 
Learn Forex: Find Out if Price Rises Proportionally To the Oscillator
Trading-Trends-With-Oscillators_body_Picture_4.png, How Oscillators Can Show You If You’re Trading Against The Trend
Courtesy of Marketscope 2.0
 
This chart brings a little more detail but the idea is clear. When you’re trading with an oscillator and you realize that price action is correcting disproportionally to the oscillator you’re trading against the trend. If you hold onto this type of trade then you could get steam-rolled when the oscillator unrolls back in the direction of the overall trend. Given the recent 500+ pip move in AUDUSD higher, if price unwinds disproportionally to the oscillator, then it may be best to get out of a short trade or consider rejoining the AUDUSD trend higher while managing your risk.
Now that you're armed with a new way to read trends with oscillators, feel free to try this information out on a FREE Forex Demo Account with access to multiple markets.

Technical analysis: EUR/USD indecisive but trend is clear

When you take a step back it’s easier to see the bigger picture and it EUR/USD the trend is undeniably higher over the past year.
The crisis in Europe is over and the recovery has been driven by investment flows. Signs continue to point to a better economy and ECB jawboning is losing effectiveness.

The past few days have show some indecision and that could mean a retest of the trend since last July. Key reports will be Eurozone consumer confidence Tuesday and the Markit PMI a day later.

Euro technical analysis April 18 2014

How to Catch Swings in the Forex Market

Of all of the different ways that traders can approach speculation in markets, Swing Trading has to be one of the more interesting.
Scalping or day-trading is largely dependent on momentum. Longer-term trading is generally dependent on data flow or macro-economic events. But swing traders generally have a plethora of opportunities, whether markets are in long-term trends or not.
We discussed this style of trading with recommendations for time frames to utilize and entry protocols in the article, The Four Hour Trader. In this article, were going to take a closer look at the types of price action events that will often take place at these swings, giving the trader the opportunity to implement a strong risk-reward ratio on the entry of the trade. 
 
The Benefit of Price Action as an Indicator
New traders will often ask what drove that move in EURUSD? Or Why did Sterling go down? And if you look hard enough, you can almost always find a reason. Most of the financial media makes a living on the explanation behind those reasons. But the fact-of-the-matter is that this hindsight type of analysis is really simple after-the-fact; but rarely relevant before-hand. And as traders, we need to be in the position before the reasons take place, so this type of hindsight is relatively worthless.
Almost every price movement in market can be boiled down to once simple factor: Supply and Demand; thats it.
If there are more buyers than sellers, then price will go up. And if there are more sellers than buyers, price will go down. This relationship is exactly why markets work. Prices reflect what the market is willing to pay. 
 
Changes in Supply and Demand create price movements
How_to_Catch_Swings_body_Picture_2.png, How to Catch Swings in the Forex Market
Created with Marketscope/Trading Station II.
 
This is why technical analysis can be so valuable: It can strip out the whys’ and focuses on the what.’
One of the downsides of technical analysis is that most indicators are lagging the market, so it just obscures traders from the current supply/demand impact on the market; and this is why price action can be so incredibly valuable.
Price action, or the study of analyzing price and price alone in a traders analysis is one of the most pure ways of performing technical analysis because it does not include any indicators that are lagging the market. If youd like to become more familiar with the study of price action, the article Four Simple Ways to Become a Better Price Action Trader can certainly help you get started. And for more advanced study, The Forex Traders Guide to Price Action can take that education a step further. 
 
Using Price Action to Catch Swings
Because price action is giving traders a direct view of the supply and demand in a market at a given point in time, traders can potentially get an early indication that a swing or reversal in prices may be near.
When market display indecision, this is showing that supply and demand is roughly equal at that moment in time. This will often show as a series of candlestick formations such as the Doji , or Spinning top formation. 
 
Indecision formations highlight potential turning points
How_to_Catch_Swings_body_Picture_7.png, How to Catch Swings in the Forex Market
 
But this indecision may take a while to play out before prices actually reverse in the other direction. In many cases, multiple spinning tops or dojis can show up before prices actually reverse. But the benefit of this prolonged period of indecision is that it highlights to traders that the supply or demand in that pair may be at a turning point.
In the article The Most Important Price Action Formation is Indecision, we look at a variety of different indecision candlestick formations that can potentially clue a trader into an upcoming reversal period.
Perhaps most importantly with indecision and swing-trading formations, traders can look for strong risk-reward ratios in an effort to avoid the Top Trading Mistake of losing so much when wrong; and making so little when correct.

Thursday, April 17, 2014

Develop a Scalping Strategy in 3 Steps

Talking Points:
  • Scalping strategies can be broken down into three components
  • Always consider market direction and the trend
  • Plan entries around retracements or breakouts
Many traders want to implement a scalping strategy, but don’t know where to get started. The truth is, you can develop a simple scalping strategy in as little as three steps. Today we will review the three components of a scalping strategy. Let’s get started! 
 
Find The Trend
The first step to scalping is finding the trend. Finding the trend is vital because it helps create our trading bias for a currency pair. For example, if the pair is creating a series of higher highs, traders would only want to look for buying opportunities. This is opposed to a graph that is moving towards lower lows, when sell positions are preferred.
Using the example below, we can see the USDCAD has been trending upwards with the creation of a series of higher highs and higher lows. This means that scalpers should look for opportunities to buy the market. 
 
Learn Forex: USDCAD 30Min Trend

Develop-a-Scalping-Strategy-in-3-Steps_body_Picture_2.png, Develop a Scalping Strategy in 3 Steps

Wednesday, April 16, 2014

The 3 Step No-Hassle Breakout Strategy

Talking Points:
  • Volatility breeds breakout trading opportunities.
  • 24-period Donchian Channel on an Hourly chart can give us medium term trade entries.
  • Stops can be set opposite of the channel break using 1:2 risk and reward ratio.
While trend trading makes up the bread and butter of my personal trading account, I also employ a breakout strategy that has yielded positive results. It’s true that breakout strategies require more time and energy than longer term trend strategies, but breakouts are easy to trade when you have set rules to follow.
The ideal breakout trade is on a currency pair that has exhibited a high level of volatility and then breaks a key support or resistance level. Pairing this type of opportunity with a sound money management plan can result in a trading edge. Today, we are going to lay out this simple, no-hassle breakout strategy in 3 steps.
Step 1: Look for Volatility
Not all market conditions are ripe for breakout trading. We need to first find the pairs that have shown the most volatility. While you can independently figure out what pairs are the most volatile by ‘eye balling’ it, we prefer using DailyFX’s Technical Analysis page.
 
Learn Forex: DailyFX Technical Analysis - Volatility
The-3-Step-No-Hassle-Breakout-Strategy_body_Picture_3.png, The 3 Step No-Hassle Breakout Strategy
(Copied from DailyFX.com’s Technical Analysis page)
 
The image above shows volatility highlighted in red. A 0% reading means a pair has shown almost no volatility while a reading of

Tuesday, April 15, 2014

Chart Of The Day For April 15th, 2014 – EUR/USD

EUR/USD Technical Strategy: Pending Short
    Support: 1.3835 (23.6% Fib exp.), 1.3793 (38.2% Fib exp.)
    Resistance: 1.3905 (Apr 11 high)

The Euro may be carving out a top below 1.39 to the US Dollar after prices put in bearish Evening Star candlestick pattern. A break below support at 1.3835, the 23.6% Fibonacci expansion, initially exposes the 38.2% level at 1.3793. Near-term resistance is at 1.3905, the April 11 swing high.

Our long-term fundamental outlook calls for a bearish bias on the Euro against the greenback. We will opt against entering short at present however with prices sitting too close to near-term support to justify a trade on risk/reward grounds, waiting for a more attractive setup to present itself.


Monday, April 14, 2014

Top Trade Idea for April 14th, 2014 – EUR/CAD

While there continue to be mixed signals in the forex market in terms of correlations, there still exist basic technical set-ups.  EUR/CAD being one to consider.

EUR/CAD is likely to run into resistance into the 1.5150 area where short positions make sense.  Stops are tight, just above 1.5184 and a downside target of 1.5080


US Dollar Chart Setup Hints at Bounce, SPX 500 Hits Two-Month Low

Talking Points:
  • US Dollar Candlestick Pattern Hints at Recovery Ahead
  • S&P 500 Sinks to Two-Month Low, Sellers Target 1800
  • Gold, Crude Oil Rise to Challenge Technical Resistance
Can’t access to the Dow Jones FXCM US Dollar Index? Try the USD basket on Mirror Trader. **
US DOLLAR TECHNICAL ANALYSISPrices put in a bullish Piercing Line candlestick pattern above support at 10401, the 76.4% Fibonacci expansion, hinting a bounce may be ahead. Breaking above the 61.8% expansion at 10439 exposes the 10475-84 area, marked by the underside of a previously broken falling channel and the 23.6% Fib retracement. Alternatively, a reversal downward below support aims for the 100% expansion at 10339.
US-Dollar-Chart-Setup-Hints-at-Bounce-SPX-500-Hits-Two-Month-Low_body_Picture_5.png, US Dollar Chart Setup Hints at Bounce, SPX 500 Hits Two-Month Low
Daily Chart - Created Using FXCM Marketscope 2.0
** The Dow Jones FXCM US Dollar Index and the Mirror Trader USD basket are not the same product.
 
S&P 500 TECHNICAL ANALYSIS – Prices continued downward as expected, breaking support at 1818.50 marked by the 50% Fibonacci expansion to expose the 61.8% level at 1799.50. This barrier is reinforced by a major rising trend line barrier set from February 2013 at 1790.70, with a daily close below that hinting a major reversal is at hand. Alternatively, a back above 1818.50 targets the 38.2% Fib at 1837.50.
 
US-Dollar-Chart-Setup-Hints-at-Bounce-SPX-500-Hits-Two-Month-Low_body_Picture_6.png, US Dollar Chart Setup Hints at Bounce, SPX 500 Hits Two-Month Low
Daily Chart - Created Using FXCM Marketscope 2.0
 
GOLD TECHNICAL ANALYSIS – Prices turned higher as expected after putting in a Bullish Engulfing candlestick pattern. Buyers are now testing resistance at 1327.29, the 23.6% Fibonacci expansion, with a break above that exposing the 38.2% level at 1358.41. Near-term support is at 1308.11, the 14.6% Fib. A reversal back below that targets the April 1 low at 1277.00.
US-Dollar-Chart-Setup-Hints-at-Bounce-SPX-500-Hits-Two-Month-Low_body_Picture_7.png, US Dollar Chart Setup Hints at Bounce, SPX 500 Hits Two-Month Low
Daily Chart - Created Using FXCM Marketscope 2.0
 
CRUDE OIL TECHNICAL ANALYSIS – Prices broke higher as expected out of a Triangle chart formation. Buyers are testing resistance at 104.33 marked by the 50% Fibonacci expansion, with a break above that exposing the 61.8% level at 105.98. Near-term support is at 102.68, the 38.2% Fib, followed by the 23.6% expansion at 100.64.
US-Dollar-Chart-Setup-Hints-at-Bounce-SPX-500-Hits-Two-Month-Low_body_Picture_8.png, US Dollar Chart Setup Hints at Bounce, SPX 500 Hits Two-Month Low
Daily Chart - Created Using FXCM Marketscope 2.0

Sunday, April 13, 2014

3 Price action strategies for forex traders

Price action strategies differ from technical led strategies as they do not rely on signals from technical indicators. Such signals can be problematic as they are often followed by thousands of other traders around the world. 

Price action strategies, on the other hand, are subjective and are drawn from a traders own perspective on the market. This causes it’s own problems as price action strategies can therefore be hard to define.

Nevertheless, many traders swear by price action techniques and here are 3 classic types.

Head and shoulders

Head and shoulders patterns form when a currency moves towards a type of ridge before moving higher once more, only to drop back towards the ridge. The two ridges are therefore the shoulders and the higher price point is the head.

What this indicates is a market that is struggling to move past the higher price levels so it’s a bearish sign. The pattern becomes even more bearish if the price moves underneath the shoulder line, and when it does a sell order should be entered into the market.

Pin bars

Pin bars, also known as dojis, are a type of candlestick price action pattern that help traders judge the momentum in the market and they can work both as reversal indicators and confirmation signals.

Pin bars occur when a market moves up or down fairly strongly, but then cannot hold onto those gains/losses. The market ends up pretty much back where it started and the candlestick ends up looking like a pin head.

It’s a classic sign that traders are winning the battle on only one side of the trend so indicates that the trend will carry on in that direction.

Wedge pattern

A wedge pattern can often be drawn onto a price chart to show a market that is converging and therefore readying for a breakout. Wedges are essentially triangle patterns and can also be called ascending, descending or bilateral triangles.

The wedge or triangle pattern is drawn from a significant high and low to a much more recent high and low. This pattern encompasses the whole of the recent price action and shows a market that is coming together in a consolidation phase.

The beauty of the wedge pattern is that the closer the two lines get to one another, the greater the inevitably of a breakout move. Since when the two lines come together, to form what is known as an apex point, the market will have nowhere to go but break out.

Bitcoin Exchange MtGox to Spend $40 Million on Restart

Bitcoins are trading slightly up today. On BTC-E, buying one piece of the virtual currency will set you back $419.7, 2$ more than yesterday. On BitStamp, purchasing the same amount of btc costs $424.9.


According to an unconfirmed translation of Japanese court documents, failed bitcoin exchange MtGox is looking to spend an astounding $40 Million on restarting operations. It is unclear if the sum will come out of the 200,000 bitcoins that the firm ‘’found’’ back on March 20th, or if the funds will be infused by an outside investor. The eye-popping figure sparked criticism among MtGox clients and creditors.

Here are some interesting excerpts from the website GoxDox.org , where the translation is located:

‘’after expenses for restarting, only ten percent of the value of the company will be left in the form of assets. This must mean they believe it necessary to spend more than half the 200k bitcoins to get the company restarted as an initial matter. Someone else can clearly do better.’’

‘’Their security expert has no background in security.  They have not named a general counsel.  They want to take all the bitcoins, fund our accounts pro rata, but not let us have them for a year.  The most sensible thing they mention is that Mark K can’t be part of management and has to give up his shares, but we all saw this coming.’’

Saturday, April 12, 2014

Range Trading Basics

Talking Points:
  • In the absence of a trend, trade market ranges
  • First identify key levels of support & resistance
  • Manage risk with a stop, in the event that price breaks
Many traders consider themselves trend traders. But what happens when the market loses its direction? Instead of being deterred by sideways price action, traders should develop a plan of action for ranging markets. Today, we will review how to identify a trading range, and an easy way to approach trading trendless markets. Let’s get started!
 
Find The Range 
The first task of range trading is to find the range! This process can be easily done by connecting a series of highs and lows with a horizontal trend line. The key is to find two points to connect on your graph. Once found, these values can be extrapolated to form a line of resistance and support, with the area in between defined as our trading range.
Below we can see an example of an active range on the EURJPY. Resistance has been formed by connecting two previous highs near 141.50. Likewise, support has been defined by connecting a series of lows near 140.60. The distance between these two points is a respective 90 pips which the range trader will look to take advantage of as long as support and resistance remain in place. 
 
Learn Forex: EURJPY 30Min Trading Range

Planning an Entry
Once levels of support and resistance have been found, traders can begin planning to enter the market. One benefit of range trading is that traders can take a non-directional look at the market and place both buy and sell orders. Since price is moving sideways, orders to buy will be placed as close to our support line as possible. If price reaches resistance, the same stance can be taken but this time range traders will have a preference to sell the market.
Traders can set entry orders near support and resistance, or even trade with market orders. If you have limited time to trade, entry orders would be the preferred method of range trading. Entry orders will remain pending until price touches the designated level, prior to execution. Market order traders may use a system of confirmation before entering. Confirmation signals may include identifying a candle pattern or incorporating an oscillator signal prior to entering the market. 
 
Learn Forex: EURJPY 30Min with Range Entries
Range-Trading-Basics_body_Picture_1.png, Range Trading Basics
 
Manage Risk
As with any trading plan, range traders need to consider risk. The major risks associated with trading ranges, comes from a potential breakout of support and resistance. In the event that support breaks, any buy positions should be vacated. As well, if resistance breaks, traders should consider the range invalidated and exit any sell orders. This process can be handled through the use of stop orders beneath levels of support or above key points of resistance.
Now that you are familiar with the basics of range trading, it’s time to practice your new skills. You can get started identifying and trading ranges with a Free Forex Demo with FXCM. This way you can develop your trading skills with the market in real time!

Friday, April 11, 2014

Top Trade Idea For April 11th, 2014 – GBP/JPY

Many traders have a favourite indicator or signal. Others try to remain agnostic, choosing the most appropriate signal for market conditions. However, many traders agree that several indicators pointing in the same direction is a stronger trade signal.

A potential triangle break, through the “big figure” of 170.00, would likely see the MACD cross as well. Looking for a swing on this signal cluster, traders may consider selling at 169.85, with a stop above the triangle top around 173.00, and a target just above support around 163.90. Shorter term traders could look at selling at the same level, with a tighter stop just above 170.00, seeking to trail a profitable trade down.

A factor in considering this trade is that it is against the consensus fundamentals of a strengthening Pound and a weakening Yen. While putting on the trade is counter intuitive, should technical selling kick in there is potential for an exaggerated move.

How to Reap Larger Rewards

Talking Points:
  • In the Top Trading Mistake, we saw how risk-reward ratios can have a large impact on performance.
  • Traders should look to minimize their risk on each trade, using stops to reinforce the ‘maximum loss.’
  • Traders can then look to maximize reward potential with trade management.
Have you ever had that trade that, at least initially, looked like it was going to work out better than you had initially hoped for?
You keep your limit on the position, and comfortably walk away from the trade knowing that your analysis, your strategy, and your hard work have all paid off. It feels as if it’s as good as ‘money in the bank.’
When you come back to check on the position, counting the profits in your head you realize that something has gone terribly wrong. The trade that once looked like a sure-fire win has turned around, and ran straight to your stop-loss.
You look at your equity; dejected from this ugly and unwelcomed surprise, and it finally sinks in: This trade that once looked like it was ‘in the bank’ actually turned into a loss. And your equity stares you in the face with only a fraction of the funds that were previously there. Disappointment reigns supreme.
This is one of the most unsavory aspects of trading. Dealing with this type of dejection isn’t easy for most in a game where rejection is a common (and regular) part of reality. This is also psychological torture, and leads many to fall victim to the Top Trading Mistake.
Most rationale people will respond accordingly… and the next time they see profits on the table they take them off quicker than your or I can say ‘close.’
But is this really the best thing to do?
Is there no other way to proactively plan around this issue?
Do you think the titans of this industry, be it Paul Tudor Jones or Warren Buffett, skirmish to quickly take profits out of fear of watching a winner become a loser?
No. As a matter of fact, Mr. Buffett has a very famous quote on this very topic:
‘Be fearful when others are greedy, and be greedy when others are fearful.’
In this article, we’ll attempt to teach you how to do that.
Why Taking ‘Quick’ Profits Can be Destructive
The Top Trading Mistake is inverse risk-reward ratios, or to put it simply: Traders can lose so much more when they are wrong than they make when they are right that even winning 60 or 70% of the time produces net losses to the portfolio.
DailyFX did an extensive research study on this very topic, and this was found to be The Number One Mistake that Forex Traders Make, authored by Mr. David Rodriguez. They take very small profits, and very large losses.
Traders took far bigger losses when they were wrong, than they made when they were right
how-to-reap-rewards_body_trade_pips.png, How to Reap Larger Rewards
Taken from The Number One Mistake Forex Traders Make, by David Rodriguez
This is indicative of traders entering positions without a plan for exit. Traders initiate a position for any number of reasons, whether they be technical, fundamental, spiritual, whatever; and they hope for the best.
When that doesn’t pan out, they scurry around the trade leaving their fate up to the ability to react in just the right way at just the right time. This is often a practice in futility.
More regularly, what happens when the trade moves in their favor is that they quickly close the position out. Being fearful that this gain might turn around and become a loss, most traders get an element of fear when, as Warren Buffett points out, they should be greedy.
On the other side of the matter, if the position moves against them, they often hold on. They want to win, and this is very natural. This is a trader being greedy when, in fact, they should be fearful. Unfortunately, this story often gets uglier from here. As the position moves further against them, many traders will dig their heels in even deeper.
‘Price has always come back to XYZ level, I just need to be patient.’
Oh ya? Tell that to the folks that bought GBPJPY at 250.00 in 2007.
Stops can keep you out of very bad positions
how-to-reap-rewards_body_Picture_2.png, How to Reap Larger Rewards
Created with Marketscope/Trading Station II; prepared by James Stanley
A quote from John Maynard Keynes on the matter: “The market can remain irrational far longer than you can remain solvent.”
Taking quick profits is so dangerous because these smaller profit amounts can’t offset larger losses. And because the future (and price movements are unpredictable), traders have to be prepared to lose on any individual position.
This is Where the Plan Comes In
The maximum loss a trader is willing to take should be calculated before any trade is ever triggered. Decide at what point you want to exit the trade because that idea didn’t work out. This is the first part of learning how to lose properly.
Provided that traders are using moderate-to-lower levels of leverage (which was our Top Trading Mistake #2), any one loss shouldn’t have a huge impact to a trader’s account.
Once the maximum loss is set for the position, the trader can place a stop at that level so that the trade will automatically close if that price is hit in the market. This is like packing your parachute before you go skydiving; or filling your oxygen tank before scuba diving.
The stop is what helps you stay alive in markets, and prevents one trade from taking 20 or 30% of your capital away on any one, individual idea.
After the maximum loss has been set, the trader can then start plotting the profit-side of the position. As recommended in Traits of Successful Traders, the minimum reward should be at least as large as the initial stop.
So, if your stop is 150 pips away from your entry price, the minimum reward should be at least 150 pips away from the entry.
But just as Warren Buffet said, traders should be greedy when others are fearful: So, should you really take that profit just because you realized a 1-to-1 risk-to-reward ratio?
No. This is when others are fearful; fearful of failure and fearful that the position will turn around against them and run to their stop.
Save your fear for positions that lose money. When a position works in the way that you had wanted, and your hypothesis for triggering the trade is proven correct: This is the time to start being greedy.
How to Have Your Cake and Eat it Too
Traders need to realize that regardless of when they entered the trade, or how much of a profit or loss has been accumulated – future price movements are always unpredictable.
There is no ultimate ‘right’ answer as to whether any one trade should be completely closed out with profits taken off-of-the-table, or whether it should be allowed to run so that bigger profits might be obtained.
Instead, traders can utilize a series of trade management techniques to try to take advantage of either situation, and once again having a plan before triggering the trade can assist.
Traders can look to scale out of winning positions as prices move in their favor, closing a portion of the trade as prices move more aggressively in their favor. This way, traders can take some profit off-of-the-table so that in the worse-case-scenario (as we examined at the beginning of this article), they have something to show for their work.
Learning to scale-out of a position can be rather complicated, so I highly recommend trying this type of trade management on a demo account before ever using it in a live trade. Demo accounts are free, and remove the risk of financial loss. I fully realize that trading demo dollars isn’t nearly as fun as having money on the line, but trading should be about profitability; not fun. Click here to sign up for a free demo account through FXCM.
A break-even stop can also be utilized so that in the event that price reverses on the remainder of the position, a loss doesn’t wipe away the accumulated profit.
A Break-Even Stop Can Function as Protection on the Remainder of the Position When Scaling-Out
how-to-reap-rewards_body_Picture_1.png, How to Reap Larger Rewards
Taken from The Break-Even Stop, by James Stanley
After the break-even stop has been set, traders can begin to discount the fear losing money on the trade. Once again, this is where greed, and not fear, should guide the trader’s decisions.
As prices continue moving in the direction the trader is looking for, additional parts of the position can be closed. If prices do reverse, the break-even stop is there to take the position out at the original entry price.
Most importantly, this allows a trader to prevent fear from taking away profit potential. If the trade has more upside left, the trader is in a position to capitalize on that by scaling-out of the winning trade as prices move in their favor.
And what if price never moves in their favor? Well, that’s what the initial stop is there for. Future price movements are always unpredictable, whether we’re in the trade already or not. The best we can do as traders and as human beings is to try to get the most out of each situation without losing too much on any one idea.

Thursday, April 10, 2014

Top Trade Idea For April 10th, 2014 – GBP/USD

This week being Bank of England’s week, we will have a look at gbpusd or the so called “cable”.

What we have above is the four hours chart and you can call that move to the upside as you wish but no impulsive move. Therefore, we should look for corrections and, at this very moment of time, it looks like a double combination, with an x wave that connects two different corrective waves that point to the upside: a flat an a zigzag.

I would say at the highs there we ended a wave a blue, and now we should head for a b wave blue that should go minimum 61.8% when compared with the previous wave a but we are preparing to book the profits a bit earlier.

Our recommendation will be to sell a move below 1.6600 area with 1.6820 stop loss and three different targets for booking 1/3 at each: 1.6459, 1.6260 and 1.5950 as the final target, just shy above the 61.8% as buyers are expected below.

That b wave ping to the upside is the end of a zigzag and from a technical perspective, we have two possibilities, both pointing towards the same direction:
one would be the market will for a flat and now we should see a five waves structure for c wave pink, in which case our entry will come;
the other would be that this zigag to the upside is actually only wave a of a contracting triangle that should break lower and the whole pattern from the lows will be called a triple combination. In this case our trade will be triggered only after the triangle will break lower as the entry is below the possible second x wave pink.

It remains to be seen if markets will confirm our scenario.

How to Determine Your Position Size

Talking Points:
  • Determining trade size is critical to risk management
  • Larger lot sizes increase profit and losses per pip
  • Use the Risk Management App to simplify calculations
Many Forex scalpers have plans for stop placement, but often forget about position size! This can be devastating to a traders account in the event that too much leverage is used when an inappropriate lot size is selected. The good news is this issue can be avoided with a few easy steps and calculations! Today we will review how to select the correct lot size for your trading plan.
 
Determine Stop Placement
The first step in determining lot size is to plan your stop placement. While this may sound counter intuitive, this step must be taken before we proceed. There are virtually limitless ways to determine where to place your stops which include finding market swings, using volatility indicators, or selecting an arbitrary value. Regardless of how you decide to place your stop, once set, remember the value of pips your stop is away from your entry. Keep this value handy as we move on to the next step!
Learn Forex: AUDNZD with a sample 15 Bar Stop
How-to-Determine-Your-Position-Size_body_Picture_3.png, How to Determine Your Position Size
 
Determine Risk %
The next task is to determine how much you wish to risk as a percentage of your account. Normally traders are recommended to employ the 1% rule. This means that traders should never risk more than 1% of their account balance on any one trading idea. That means using the math above, if you are trading a $10,000 account you should never risk more than $100 on any one positions. Keep this total in mind as well, as we work to our final goal of determining the appropriate position size.
How-to-Determine-Your-Position-Size_body_Picture_2.png, How to Determine Your Position Size
Evaluate Pip Cost and Lot Size
Next we will need to determine pip cost. Pip cost by definition is how much you stand to earn or lose per pip, as a trade moves in and out of your favor. This number becomes critical when we begin to evaluate trade size and risk on an individual position, because the larger the position we trade the more we stand to lose per pip. So how big should our trade size be?
The key is to take your total risk (1% of Balance) and divide this value by the number of pips you are risking. The result is the value you should be risking per pip to meet this requirement. Traders can then adjust their lot size to fit the pip cost needed. The example above shows a trade with a sample $10,000 balance. If we wanted to risk $100 (1% of balance) on a 10 pip stop, we would need to use a 100k trade size. If we lose $10 a pip for a 10 pip stop loss this puts our total loss at $100 or 1% of our $10,000 balance.
How-to-Determine-Your-Position-Size_body_Picture_1.png, How to Determine Your Position Size
 
Risk Management App
Now that you know how to calculate your proper trade size, let’s simplify the process. FXCM has an application available for the Marketscope 2.0 charting software designed to help determine how much risk is being assumed on any one particular trade. Once added to your chart, the FXCM Risk Calculator, as depicted above, has the ability to help a trader calculate risk based off of trade size and stop levels.
We walk through the application, as well as how to manage risk in several videos embedded into the brainshark medium. After clicking on the link below, you’ll be asked to input information into the ‘Guestbook,’ after which you’ll be met with a series of risk management videos along with download instructions for the application.