Talking Points:
- US Dollar Candlestick Pattern Hints at Recovery Ahead
- S&P 500 Sinks to Two-Month Low, Sellers Target 1800
- Gold, Crude Oil Rise to Challenge Technical Resistance
Can’t access to the Dow Jones FXCM US Dollar Index? Try the USD basket on Mirror Trader. **
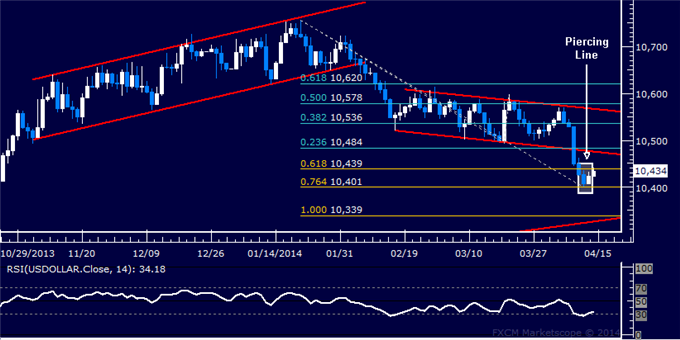
US DOLLAR TECHNICAL ANALYSIS – Prices put
in a bullish Piercing Line candlestick pattern above support at 10401,
the 76.4% Fibonacci expansion, hinting a bounce may be ahead. Breaking
above the 61.8% expansion at 10439 exposes the 10475-84 area, marked by
the underside of a previously broken falling channel and the 23.6% Fib
retracement. Alternatively, a reversal downward below support aims for
the 100% expansion at 10339.
Daily Chart - Created Using FXCM Marketscope 2.0
** The Dow Jones FXCM US Dollar Index and the Mirror Trader USD basket are not the same product.
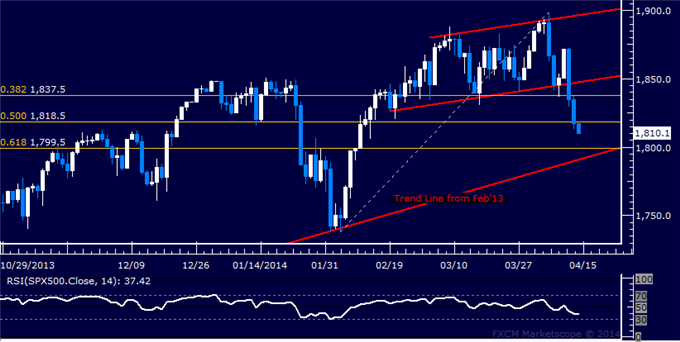
S&P 500 TECHNICAL ANALYSIS – Prices continued downward as expected,
breaking support at 1818.50 marked by the 50% Fibonacci expansion to
expose the 61.8% level at 1799.50. This barrier is reinforced by a major
rising trend line barrier set from February 2013 at 1790.70, with a
daily close below that hinting a major reversal is at hand.
Alternatively, a back above 1818.50 targets the 38.2% Fib at 1837.50.
Daily Chart - Created Using FXCM Marketscope 2.0
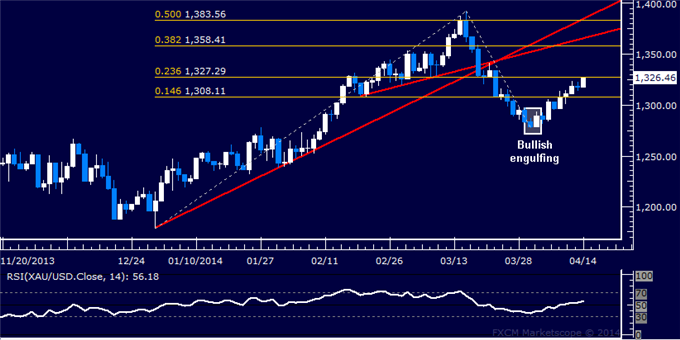
GOLD TECHNICAL ANALYSIS – Prices turned higher as expected
after putting in a Bullish Engulfing candlestick pattern. Buyers are
now testing resistance at 1327.29, the 23.6% Fibonacci expansion, with a
break above that exposing the 38.2% level at 1358.41. Near-term support
is at 1308.11, the 14.6% Fib. A reversal back below that targets the
April 1 low at 1277.00.
Daily Chart - Created Using FXCM Marketscope 2.0
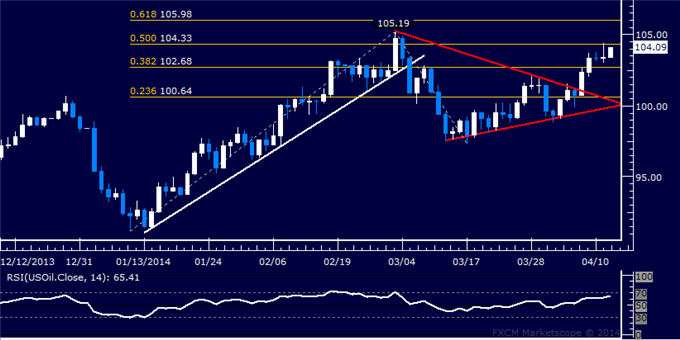
CRUDE OIL TECHNICAL ANALYSIS – Prices broke higher as expected
out of a Triangle chart formation. Buyers are testing resistance at
104.33 marked by the 50% Fibonacci expansion, with a break above that
exposing the 61.8% level at 105.98. Near-term support is at 102.68, the
38.2% Fib, followed by the 23.6% expansion at 100.64.
Daily Chart - Created Using FXCM Marketscope 2.0
No comments:
Post a Comment