TheDow Jones-FXCM U.S. Dollar Index (Ticker: USDollar), has been quietly putting in a series of lower highs and lower lows for the past four months. Though this downtrend has been in force for a while, we believe there is still one more opportunity to sell the Greenback with a good risk to reward ratio.
Here are two technical reasons the USDOLLAR may continue to slide.
SSI Shows Retail Traders are Currency Buying USD
FXCM’s Speculative Sentiment Index (SSI) is a
sentiment reading much like the COT report in futures trading or the
Put/Call ratio in equity trading. SSI is a good contrarian indicator
such that when a large number of traders are already positioned in a
pair to one side of the trade AND if they are trading against the trend,
more often, they end up being wrong on the trade.
In this case, traders are significantly positioned
as US Dollar buyers. Since the trend has been towards USD weakness,
these traders are fighting the trend. SSI is giving us a broad based
signal that USD weakness is likely to continue.
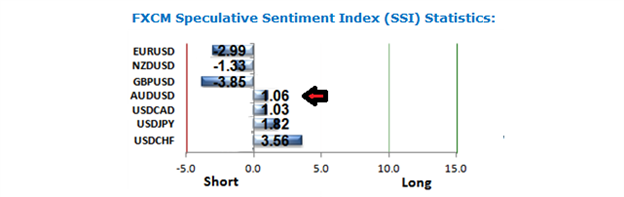
Taken from FXCM’s SSI reading April 21, 2014
In the chart above, you’ll see how traders are positioned for Greenback strength in all of the majors, except the AUDUSD. For example, the EUR/USD shows a ratio of -2.99. This means there are nearly 3 traders short the EUR/USD for every trader who is long.
With this much broad sentiment based towards US
Dollar strength, the contrarian reading suggests the US Dollar is likely
to continue getting weaker.
(See FXCM’s SSI readings twice per day inside DailyFX Plus with your live account username and password. If you don’t have a live FXCM account, then you can subscribe monthly.)
Using Wave Relationship to Guide our Trade
The second technical reason to sell the Dollar is based on Elliott Wave analysis.
When looking at the waves of the USDOLLAR chart,
prices have aggressively sold off in late March and early April 2014. It
is possible that those moves down were waves 1 and 3 of a five wave sequence. If this is the pattern,
then we are currently in a wave 4 counter trend retracement higher
which will eventually give way to a fifth and final wave lower.
Elliott wave is a challenging type of technical
analysis. Though it is difficult to learn, the benefits of even
understanding it at a basic level can help you identify points on the
chart to place a stop loss and take profits.
Forex Education: Completing the 4th wave of a 5 wave sequence
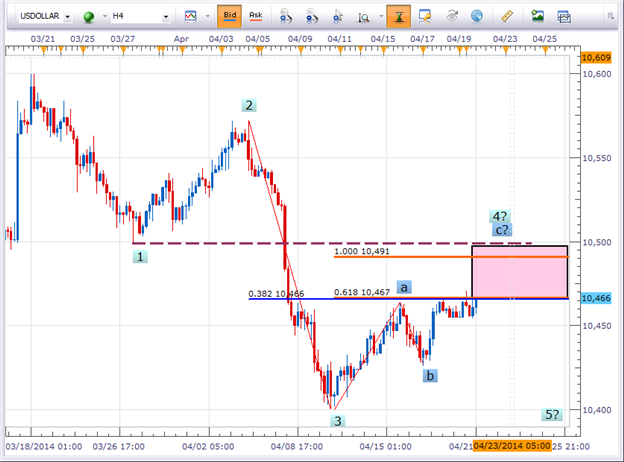
(Created using FXCM’s Marketscope 2.0 charts)
One of the rules in Elliott Wave is that wave 4 cannot enter into the territory of wave 1 in a five wave impulsive move.
If the labeling on the chart above is correct, then that means that wave 4 would not enter into the low from March 27 (see purple dotted line). If it does, then the labeling on this chart is incorrect and some other pattern is developing.
We can also use wave relationships to identify if we are getting close to an ideal entry point.
In a three wave corrective move (see the dark blue
a-b-c labels above), wave c oftentimes has a length relationship to wave
a. As we can see above, the orange horizontal lines illustrates where
the length of wave c is 61.8% the length of wave a, a common relationship.
Also, a typical stopping
point for wave 4 is at a 38.2% retracement of wave 3. Adding our
Fibonacci retracement levels to the chart, we see that the 38.2%
retracement of wave 3 is near 10,466.
As you can see, both the orange and blue lines are
VERY close to one another. This strong wave relationship is part of the
reason why prices are having a hard time moving higher.
Another wave relationship guideline is that wave 5 tends to have a wave relationship with wave 1 in terms of equality. Said another way, the size of wave 5 tends to equal the length of wave 1. That would mean wave 5 would modestly surpass the end of wave 3 and fall into the 10,375-10,400 zone.
Since this is the pattern we are favoring right now,
we can enter the trade with a stop loss 1 pip above the low of March 27
(the low of wave 1). That means the stop loss on the trade would be
placed at 10,500.
If we enter near the current market price and look
to take profits near 10,400, that means our trading opportunity would
have a 1:2 risk-to-reward ratio.
For those account holders who reside outside of the
United States, you can place this trade through the USDOLLAR instrument.
You should be able to see this appear on your platform.
For residents inside the United States, you can place a basket trade. There are several benefits to trading a currency rather than a pair. The Mirror platform allows you to place a US Dollar Sell Basket with one click. You can register for a free Mirror practice account if you would like to try it out.
No comments:
Post a Comment