Thursday, May 22, 2014

Simple Way to Avoid False Breakouts

Breakout trading can be a rewarding strategy in volatile markets, but is often plagued with fake signals and false breakouts that can discourage even the best traders. Today, we will cover what a fake breakout is and how to avoid them in our trading.
 
What is a False Breakout?
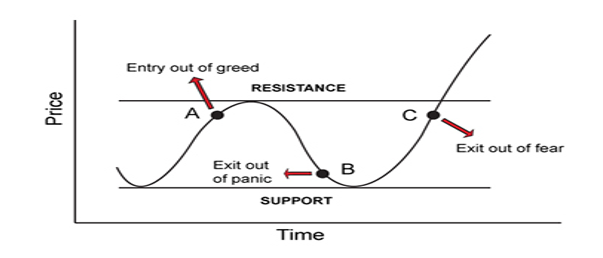
A false breakout is when price temporarily moves above or below a key support or resistance level, but then later retreats back to the same side as it started. This is the worst case scenario for a breakout trader that enters in a trade as soon as price breaks. We are immediately faced with a red arrow on our chart and the breakout we traded is looking less and less real.
Being forced to watch as breakout trades disintegrate in front of us is tough to swallow, and we are left deciding whether we should stay in and “ride it out” or close the trades for a quick loss. Neither of those options sound very appealing. So to avoid this in the future, we need to add a new rule to our existing breakout trading strategy.
 
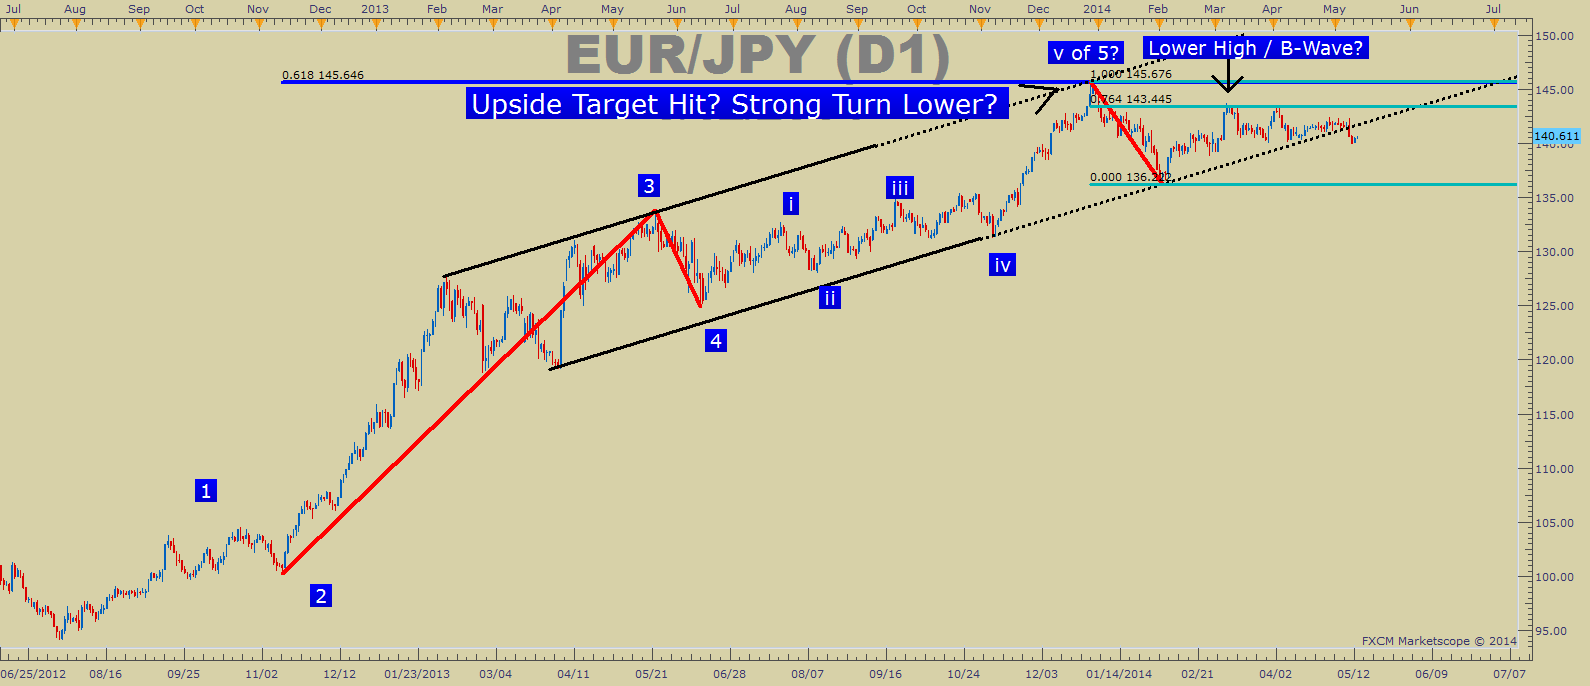
Learn Forex: Avoiding False Breakouts
Simple Way to Avoid False Breakouts
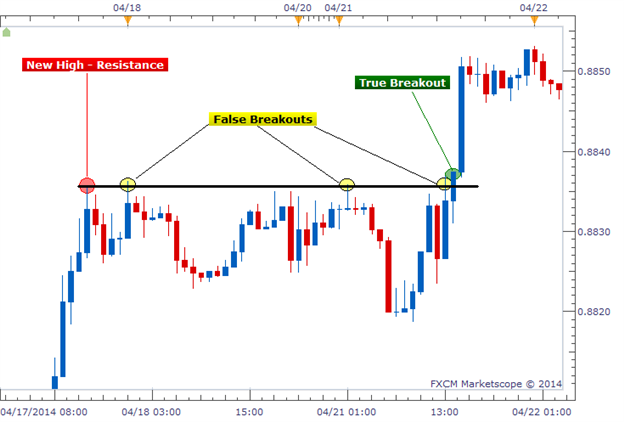
(Created using Marketscope 2.0 Charting Platform)
 
How to Avoid a False Breakout
The solution to this problem is actually pretty simple (as depicted above). Rather than act on a trade in real time as soon as price breaks a key level, we should wait until the candle closes to confirm the breakout’s strength. So the idea of setting entry orders above or below a support or resistance levels to automatically get us into a breakout trade is not a very good one. Entry orders allow us to get “wicked” into breakout trades that never actually materialize.
On the surface, this would lead us to believe that the only way to effectively trade breakouts, is to be at our trading terminals ready to act as soon as the candle closes in breakout territory. Once the candle closes, we can then open our position that hopefully has a higher chance of success. But what if we don’t have all day to sit around and wait for breakouts?
 
Setting Alerts Based on the Candles’ Close Prices
So, if physically waiting at your computer for a breakout is not an option, I recommend using a price alert that uses each candle’s closing price as its trigger. In other words, you will only receive an alert if support or resistance is broken and remains broken through the close of that specific candle. That way you can receive your alert, log in on your computer or mobile application and 
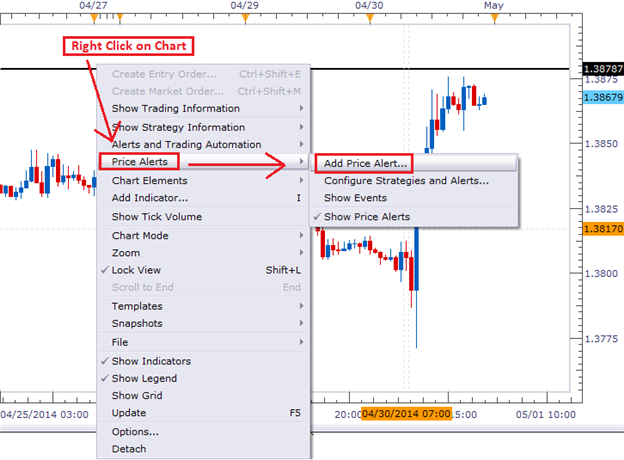
place the trade. To set this up, we need to right-click on our chart and select “Add Price Alert.”
 
Learn Forex: Add a Price Alert in Marketscope
Simple Way to Avoid False Breakouts
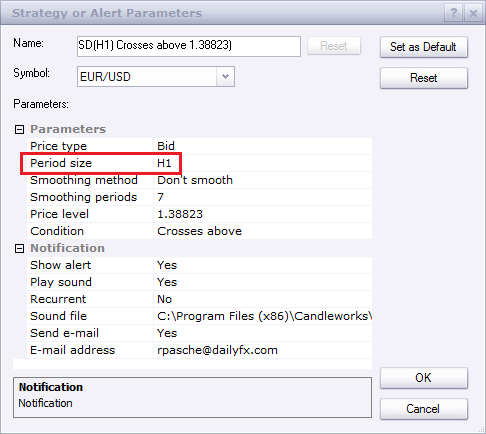
The specific price alert option we need to look at is the Period. This is where we select the size of chart we are looking at; Daily, 4-hour, 15-minute, etc. In the example below, we were looking at an hourly chart. So we selected “H1” for our period.
 
Learn Forex: Selecting the Period Size in Price Alert Menu
Simple Way to Avoid False Breakouts
 
Once selected, we will only be alerted if a candle closes beyond the price level we selected rather than alerted as soon as the price is broken in real time. For an hourly chart, that mean we could only be alerted at the top of the hour, after each bar closes. This is exactly what we were looking for.
 
Avoiding False Breakouts
This tiny tweak can make a big impact on your breakout trading. But like always, I recommend making these changes to your strategy in a demo environment before testing them with real money. You can sign up for a free FXCM demo account here.

Monday, May 19, 2014

Becoming an Emotionally Intelligent Trader

We’re only in it for the money. That key trading concept is obvious but shouldn’t be forgotten. The reason why this mantra is key is because we’re not into trading for the following reasons:
-To Beat the Market
-To Show People How Smart You Are
-To Feel Excitement through use of Aggressive Leverage
If you’re interested in learning what else, besides emotions, it takes to trade like a professional trader, register for our free course here.
 
Why Emotions Get Shunned By Traders
Some traders opt for an Automated Trading or Black Box strategy. The purpose of a black-box system is to have your preferred trading rules or edge programmed so as to put you into a trade and exit you from a trade when the edge is gone or the profit target is achieved. The argument of this approach is that your emotions can’t get in the way of you entering or exiting a trade. However, a trading career is made up of more than just on trade and if you do not have the emotional strength to stick with your edge, programmer or discretionary, then your emotions are still getting the best of you.
Becoming an Emotionally Intelligent Trader
Either way, your emotions are at play. If you’re deciding when to enter the trade yourself, known as discretionary trading, your emotions are obviously at play. The way emotions effect newer traders is that new traders hope their losses will come back so they let them run in order to avoid booking a loss. They fear that their profits will turn into losses so they cut them short. However, this fear and hope tug-of-war doesn’t work out in the traders favor in the long term.
Becoming an Emotionally Intelligent Trader
 
A Better Way to Look at Emotions
Emotions aren’t bad if you know how to steer them towards your benefit. By default, you likely don’t like being wrong or losing money, who would? However, taking a big picture view, being wrong sometimes and losing a little money when deciding if the market is going to move in the direction you believe it will, these two things aren’t that bad and are in fact, inevitable.
So a better way to look at emotions is to flip how you’re using hope and fear and most specifically fear. If you can switch your fear from a place of fearing a losing to trade to fearing a losing trade getting out of control, you’ll discover a key emotional truth to trading well, regardless of your balance.
As the opening quote mentions, instead of hoping that your loss will turn into a profit so you don’t look like a failure, you should hope that your profits grow larger while always fearing a large relative loss. By flipping these from there default function, you’re no longer holding onto a losing trading waiting for it to come back while closing out your good trades at a minimal profit afraid that the profit will slip through your fingers. As Michael Martin put it, that’s like pulling your flowers and letting your weeds flourish in hoping they change. 
 
Applying Your Emotions to FX Trading Appropriately
 
Becoming an Emotionally Intelligent Trader
 
So now that you know that your emotions are not your enemy when appropriately adjusted, what’s the best way to apply this information? This may come as a shock, but you need to start from the premise that you don’t know FOR SURE if your next trade will hit its protective stop or profit target. Of course, you’d prefer that every trade hit its profit target but by now, you know that’s not always the case.
However, like the picture from above, you’re not sure if the next trade will take you off the road you were planning on driving down (read: the trend bends or ends to get you out of your trade). Therefore, when you’re in a trade based on your edge or indicators, it’s best to keep an eye for trades that go against you from the start and see that it’s best to fear these trades and get out there or just accept that your profit target most likely will not get hit but whatever you do, don’t remove your stop and hope for a trade that goes sour right away. These are the trades you should rightly fear draining your equity.
On the flip side, if you’re entering at the right time and price (unbeknownst to you or not), and the trade goes in your favor right away, then it’s best to keep the hope in play that this could be a big move that makes your day, week, month, or year and move your stop up to break even when your system sees it appropriate.
I’ll leave you with a quote from Michael Martin that’s been helpful for me and I hope it does the same for you. “Winners never quit, but quitters have more equity in their accounts when they admit defeat and return tomorrow with a fresh start and a clear head.” This world of trading is a paradox, the trading paradox involves embracing losing trades early and often while allowing those few golden trades make your year.
Now that you're familiar with a new way of handling emotions while trading, feel free to try this information out on a FREE Forex Demo Account with access to multiple markets.

Thursday, May 15, 2014

Top Trade Idea For May 15th, 2014 – EURUSD


As the ECB came last week and messed up all the technical charts possible with the bearish statement calling for acting next time they meet in June, it is about time to re-evaluate the situation on the eurusd and check if there is still something there for the eurusd bulls.

Therefore, this scenario should be called, if you want, the last chance for eurusd bulls.

What we are having here is a daily chart that looks at the move from the 1.20 area to the upside and from my point of view it is still possible that the whole corrective wave following wave 1 blue to be a double three running, and this is ending almost always with a contracting triangle.

The triangle that you are seeing there is not a classical contracting triangle but a running variation of it, and the recent 1.3994 rejection comes from the apex of the triangle.

In such a triangle, the e wave should not end below 61.8% when compared with the previous d wave and this should be the stop loss, anywhere in the 1.3550/70 area.

The target on the other hand is more than generous as it implies 1.40 to come in a jiffy, considering the time frame.

And that should be just the beginning of a strong impulsive move to follow.

It remains to be seen if the markets will confirm it.

Tuesday, May 13, 2014

A Tasty EURJPY Ichimoku Set-Up As The

From late 2012 to the 1st trading day of 2014, many traders felt the downtrend in the JPY which pushes higher JPY crosses couldn’t be stopped. A lot of the downfall in the JPY has been on the back of a major monetary policy committee. For a while, the monetary policy taken on by the Bank of Japan seemed to have all but sealed the victory of their war on inflation all the while weakening the JPY. However, 2014 hasn’t been kind to those looking for a weaker JPY and given the impending 
 
EURJPY - An Impressive Trend
When you step back, you realize the EURJPY was the perfect long trend trade based on each country’s monetary policy standings in mid-2012. In late July, Mario Draghi of the European Central Bank stated that they would do, “whatever it takes”, which marked the low in many EURO crosses. At the same time, Shinzo Abe was running for Prime Minister in Japan, and he was promising a restoration of economic pride by raising inflation which would weaken the JPY and it did. This made EURJPY a screamer to the upside since summer 2012, but 2014 has brought of shifting of tides that could allow us to find a trading opportunity to the downside. 
 
Learn Forex: EURJPY Has Finally Found Resistance
A Tasty EURJPY Ichimoku Set-Up As The
Presented by FXCM’s Marketscope Charts
The bottom left of the chart has the low put in before Draghi’s comment mentioned earlier. As Euro strength began to gather steam, so did JPY weakness. The JPY weakness ran throughout the currency world but was most cleanly seen in EURJPY, which rose 5,100+ pips from mid-2012 to the beginning of 2014. After this strong push higher, we’re going to look for a reversal or trend trading correction as per Ichimoku rules to help us enter a higher probability trade. 
 
Long Term Resistance
If we’re looking for a trade against the trend from mid-2012, the first thing we want to see is levels and tools like oscillators that show us that EURJPY is running out of steam. We have both in looking at the Relative Strength Index & the 2009 intraday high of 139.214 which are tipping us off to the potential for a strong turn to the downside. Additionally, Elliott Wave also shows common patterns that play out before another counter leg-move. If you’re unfamiliar with Elliott Wave, here’s a quick breakdown of the tenets. 
 
Learn Forex: 2009 High Could Soon Break As Support
A Tasty EURJPY Ichimoku Set-Up As The
Presented by FXCM’s Marketscope Charts
Looking above, you’ll notice that the 2009 Top is under pressure and a handful of Fibonacci Resistance levels clustered around the 144 level which as acted as resistance for a majority of 2014. The RSI tool shows us a clear divergence from the May peak to the December ’13 peak so that we can look for moves lower. Lastly, before we get to Ichimoku for triggers, you can see from the top chart that a trendline dating back to February 2013 and the October ’13 low broke last week, which further shows us weakening of the uptrend. Now, let’s look at Ichimoku. 
 
Ichimoku Set-Up with Key Levels
Last week, the European Central Bank said that they were comfortable with the idea of cutting rates in June in order to ease the pressure of low inflation on the economy. This week, ECB member, Vitor Constancio said that he estimated the high levels on the EUR have likely been the reason for 0.5% drop in inflation in recent months. As the ECB began to express distaste for a higher Euro, many traders began to sell aggressively and that brings about an opportunity on EURJPY. 
 
Learn Forex: A Lagging Line Bearish Break Would Trigger a EURJPY Short
A Tasty EURJPY Ichimoku Set-Up As The
Presented by FXCM’s Marketscope Charts
 
Ichimoku Trade: Sell EURJPY on a Close & Lagging Line below Daily Cloud @ 140.00
Stop: 142.50 (Above Exhaustion Point of Triangle and 2014 Trendline)
1st Limit: 136.65 (Just above 2014 Low & 61.8% Expansion of A Wave from End of Triangle)
2nd Limit: 133.05 (Equal Wave Target whereas C=A)
If this is your first reading of the Ichimoku report, here is a recap of the traditional rules for a sell trade:
-Price is below the Kumo Cloud
-The trigger line (black) is below the base line (light blue) or is crossing below
-Lagging line is below price action from 26 periods ago (we also received confirmation on cloud bounce)
-Kumo ahead of price is bearish and falling
-Entry price is not more than 300 pips away from base line as it will likely whip back to the line if we enter on an extended move.