Showing posts with label forex strategies. Show all posts

Tuesday, June 3, 2014

How to Trade Gold in an Oversold Market

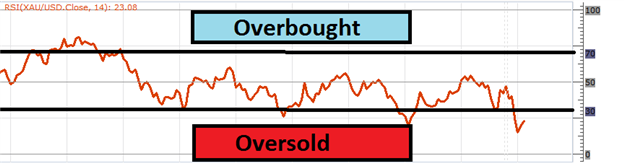
The Relative Strength Index (RSI) is a poplar oscillating indicator designed to help us determine market momentum and pinpoint entries during a variety of trading conditions. However, depending on if the market is ranging or trending, traders should approach the overbought and oversold RSI values seen below very differently. Today we are going to review the trend developing in gold (XAU/USD), and how RSI can be used to enter into strong moving trends.
How to Trade Gold in an Oversold Market
RSI Crossovers
Normally traders will use the RSI indicator for what is known as a crossover. A crossover occurs when RSI swings through an overbought or oversold value, then cross back through the selected value. The idea behind this is to enter new trades when momentum returns to the market. This can be a great strategy and normally will work when the market is in a range bound environment used in conjuncture with a support and resistance levels. Ultimately, traders using crossovers are looking to buy when prices are low or sell when prices are relatively high.
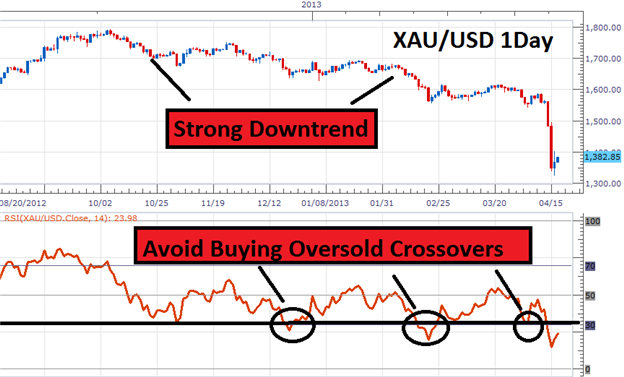
However, at the moment this strategy is not conducive for trading strong trends such as gold. Due to the market being in a downtrend, traders should absolutely avoid entering trades when RSI crosses back above oversold values. While traders may be inclined to buy low at these points, the chart below shows in most instances prices continuing toward lower lows. So the question is, how can RSI be helpful in directional markets.
Learn Forex – XAU/USD with RSI Crossovers
How to Trade Gold in an Oversold Market
Using RSI Momentum
When it comes to trending markets, it is important to remember that RSI is a momentum oscillator. Because of this, it is normal for RSI to remain oversold in a downtrend for some time. This can often be disheartening for swing traders as they wait for RSI to move back above oversold values for a chance to sell a RSI crossover in a downtrend. The good news is, this is not the only way to trade using RSI! Let’s look at another way of trading the indicator.
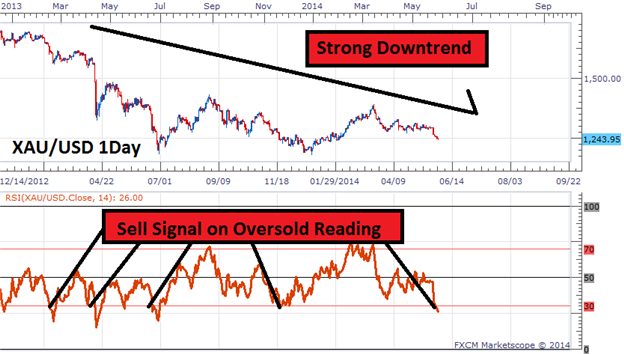
One of the most overlooked ways we can use RSI in trending environment is to sell into oversold values. This style of trading may seem counter intuitive at first, but it is very similar to trading a breakout strategy. As price continues to decline and work to create new lows RSI should move to lower lows as well. Traders watching this momentum can actually institute new trades when RSI moves below 30 (Oversold). The Daily Gold chart below is an excellent example of this technique at work. Instead of buying an oversold crossover, traders will look to sell as soon as RSI becomes oversold.
Learn Forex – XAU/USD with Oversold Entry
How to Trade Gold in an Oversold Market
The key to using RSI in this manner is that markets must remain trending. For gold, this can continue as long as fresh lows are put in place. It is important to remember that market conditions are always subject to change. In the event that the current trend ends, RSI traders can then shift gears and begin using RSI in another format.
As you can see, RSI is a versatile indicator for timing entries in a variety of market conditions. To learn more about RSI and how it can be used in an active trading plan, sign up for the DailyFX RSI training course linked below. Registration is free, and the course will include videos, checkpoint questions and access to an advanced RSI strategy. 

Saturday, May 31, 2014

Strong Weak Analysis for Scalpers

Forex traders have a variety of options when it comes to trading. However, those traders who are looking to peruse scalping opportunities will most directly benefits from identifying the strongest and weakest currencies, while identifying inter day price action including levels of support and resistance. To help us with this task today we will be using the Strong Weak app coupled with Camarilla Pivots. Let’s begin! 
 
Picking a Currency Pair
 
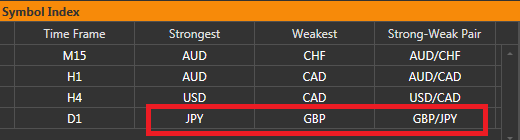
Scalping is all about momentum and market conditions. This means traders should be actively looking for pairs where a strong currency is pitted against a weaker one. The reason for this is to identify an active market trend in witch to participate. Below we can currently see the GBPJPY listed as a weak currency using the Strong Weak Application from the FXCM App Store. Knowing this, traders will look for opportunities to sell the pair while looking for scalping opportunities.
If you are unfamiliar with Strong Weak analysis, that is ok. You can review the app along with two of its uses through a series of videos linked below. After clicking on the link, you’ll be asked to input information into the ‘Guestbook,’ after which you’ll be met with a series of videos along with additional information regarding the Strong Weak application.
 
Risk Management App and Review via Brainshark
 
Learn Forex –Strong Weak App
Strong Weak Analysis for Scalpers


 Scalping A Retracement
 

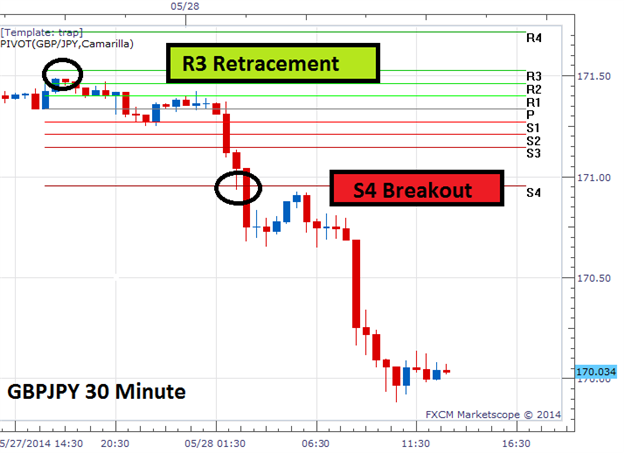
Once a currency pair has been selected for trading, it is time to pick a strategy for trading. To help aid in this decision, traders can use Camarilla pivots to identify key technical levels for trading. Below we can see these pivots in action with key levels of resistance labeled R1-4 and support labeled S1-4.
The first methodology of trading pivots is to look for a retracement. Retracement traders will look for pullbacks in the trend and look to enter the market near a point of support and resistance. If price is in a downtrend, such as the GBPJPY, traders will look for price to move to resistance and then enter fresh sell orders. Below we can see price action from this morning’s trading of the GBPJPY. First price moved up to resistance (R3), before momentum returned to the market and offering traders their first opportunity to enter fresh orders. 
 
Learn Forex – GBPJPY with Camarilla Pivots
 
Strong Weak Analysis for Scalpers
(Created using FXCM’s Marketscope 2.0 charts) 
 
Trading a Breakout

The second methodology of trading Camarilla Pivots is by looking for a breakout. Above we can see a breakout occurring today on the GBPJPY at the S4 support pivot. S4 represents the last line of daily support for a currency and in a downtrend and can offer a distinct area to enter new sell orders. This process can be inverted for an uptrend, looking to sell a breakout above the R4 resistance pivot.
These are just two of the most popular ways to approach scalping Forex pairs with pivot points. Now that you are more familiar with this methodology, you can practice what you have learned using a demo account. You can get started by registering for a Free Forex Demo with FXCM. This way you can develop your trading skills while continuing to track the market in real time.

Thursday, May 22, 2014

Simple Way to Avoid False Breakouts

Breakout trading can be a rewarding strategy in volatile markets, but is often plagued with fake signals and false breakouts that can discourage even the best traders. Today, we will cover what a fake breakout is and how to avoid them in our trading.
 
What is a False Breakout?
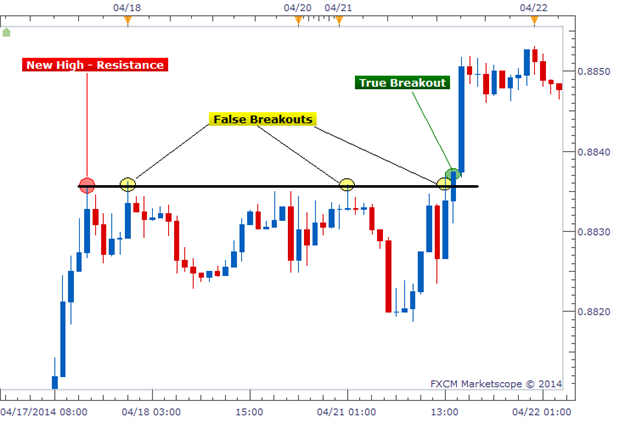
A false breakout is when price temporarily moves above or below a key support or resistance level, but then later retreats back to the same side as it started. This is the worst case scenario for a breakout trader that enters in a trade as soon as price breaks. We are immediately faced with a red arrow on our chart and the breakout we traded is looking less and less real.
Being forced to watch as breakout trades disintegrate in front of us is tough to swallow, and we are left deciding whether we should stay in and “ride it out” or close the trades for a quick loss. Neither of those options sound very appealing. So to avoid this in the future, we need to add a new rule to our existing breakout trading strategy.
 
Learn Forex: Avoiding False Breakouts
Simple Way to Avoid False Breakouts
(Created using Marketscope 2.0 Charting Platform)
 
How to Avoid a False Breakout
The solution to this problem is actually pretty simple (as depicted above). Rather than act on a trade in real time as soon as price breaks a key level, we should wait until the candle closes to confirm the breakout’s strength. So the idea of setting entry orders above or below a support or resistance levels to automatically get us into a breakout trade is not a very good one. Entry orders allow us to get “wicked” into breakout trades that never actually materialize.
On the surface, this would lead us to believe that the only way to effectively trade breakouts, is to be at our trading terminals ready to act as soon as the candle closes in breakout territory. Once the candle closes, we can then open our position that hopefully has a higher chance of success. But what if we don’t have all day to sit around and wait for breakouts?
 
Setting Alerts Based on the Candles’ Close Prices
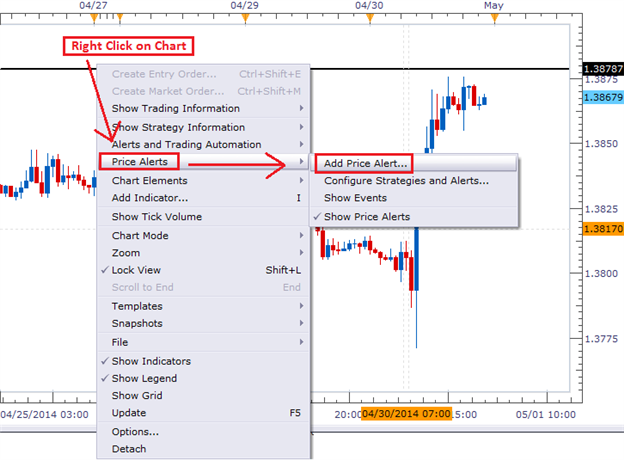
So, if physically waiting at your computer for a breakout is not an option, I recommend using a price alert that uses each candle’s closing price as its trigger. In other words, you will only receive an alert if support or resistance is broken and remains broken through the close of that specific candle. That way you can receive your alert, log in on your computer or mobile application and place the trade. To set this up, we need to right-click on our chart and select “Add Price Alert.”
 
Learn Forex: Add a Price Alert in Marketscope
Simple Way to Avoid False Breakouts
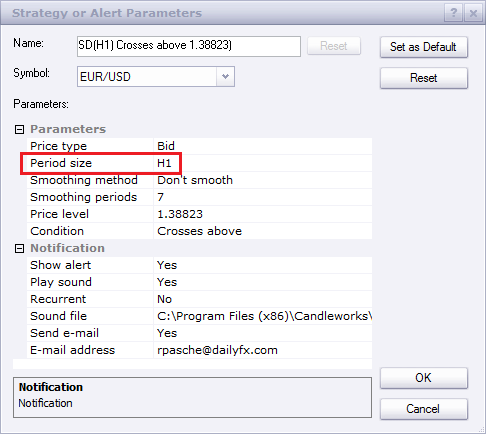
The specific price alert option we need to look at is the Period. This is where we select the size of chart we are looking at; Daily, 4-hour, 15-minute, etc. In the example below, we were looking at an hourly chart. So we selected “H1” for our period.
 
Learn Forex: Selecting the Period Size in Price Alert Menu
Simple Way to Avoid False Breakouts
 
Once selected, we will only be alerted if a candle closes beyond the price level we selected rather than alerted as soon as the price is broken in real time. For an hourly chart, that mean we could only be alerted at the top of the hour, after each bar closes. This is exactly what we were looking for.
 
Avoiding False Breakouts
This tiny tweak can make a big impact on your breakout trading. But like always, I recommend making these changes to your strategy in a demo environment before testing them with real money. You can sign up for a free FXCM demo account here.

Monday, May 19, 2014

Becoming an Emotionally Intelligent Trader

We’re only in it for the money. That key trading concept is obvious but shouldn’t be forgotten. The reason why this mantra is key is because we’re not into trading for the following reasons:
-To Beat the Market
-To Show People How Smart You Are
-To Feel Excitement through use of Aggressive Leverage
If you’re interested in learning what else, besides emotions, it takes to trade like a professional trader, register for our free course here.
 
Why Emotions Get Shunned By Traders
Some traders opt for an Automated Trading or Black Box strategy. The purpose of a black-box system is to have your preferred trading rules or edge programmed so as to put you into a trade and exit you from a trade when the edge is gone or the profit target is achieved. The argument of this approach is that your emotions can’t get in the way of you entering or exiting a trade. However, a trading career is made up of more than just on trade and if you do not have the emotional strength to stick with your edge, programmer or discretionary, then your emotions are still getting the best of you.
Becoming an Emotionally Intelligent Trader
Either way, your emotions are at play. If you’re deciding when to enter the trade yourself, known as discretionary trading, your emotions are obviously at play. The way emotions effect newer traders is that new traders hope their losses will come back so they let them run in order to avoid booking a loss. They fear that their profits will turn into losses so they cut them short. However, this fear and hope tug-of-war doesn’t work out in the traders favor in the long term.
Becoming an Emotionally Intelligent Trader
 
A Better Way to Look at Emotions
Emotions aren’t bad if you know how to steer them towards your benefit. By default, you likely don’t like being wrong or losing money, who would? However, taking a big picture view, being wrong sometimes and losing a little money when deciding if the market is going to move in the direction you believe it will, these two things aren’t that bad and are in fact, inevitable.
So a better way to look at emotions is to flip how you’re using hope and fear and most specifically fear. If you can switch your fear from a place of fearing a losing to trade to fearing a losing trade getting out of control, you’ll discover a key emotional truth to trading well, regardless of your balance.
As the opening quote mentions, instead of hoping that your loss will turn into a profit so you don’t look like a failure, you should hope that your profits grow larger while always fearing a large relative loss. By flipping these from there default function, you’re no longer holding onto a losing trading waiting for it to come back while closing out your good trades at a minimal profit afraid that the profit will slip through your fingers. As Michael Martin put it, that’s like pulling your flowers and letting your weeds flourish in hoping they change. 
 
Applying Your Emotions to FX Trading Appropriately
 
Becoming an Emotionally Intelligent Trader
 
So now that you know that your emotions are not your enemy when appropriately adjusted, what’s the best way to apply this information? This may come as a shock, but you need to start from the premise that you don’t know FOR SURE if your next trade will hit its protective stop or profit target. Of course, you’d prefer that every trade hit its profit target but by now, you know that’s not always the case.
However, like the picture from above, you’re not sure if the next trade will take you off the road you were planning on driving down (read: the trend bends or ends to get you out of your trade). Therefore, when you’re in a trade based on your edge or indicators, it’s best to keep an eye for trades that go against you from the start and see that it’s best to fear these trades and get out there or just accept that your profit target most likely will not get hit but whatever you do, don’t remove your stop and hope for a trade that goes sour right away. These are the trades you should rightly fear draining your equity.
On the flip side, if you’re entering at the right time and price (unbeknownst to you or not), and the trade goes in your favor right away, then it’s best to keep the hope in play that this could be a big move that makes your day, week, month, or year and move your stop up to break even when your system sees it appropriate.
I’ll leave you with a quote from Michael Martin that’s been helpful for me and I hope it does the same for you. “Winners never quit, but quitters have more equity in their accounts when they admit defeat and return tomorrow with a fresh start and a clear head.” This world of trading is a paradox, the trading paradox involves embracing losing trades early and often while allowing those few golden trades make your year.
Now that you're familiar with a new way of handling emotions while trading, feel free to try this information out on a FREE Forex Demo Account with access to multiple markets.

Thursday, May 15, 2014

Top Trade Idea For May 15th, 2014 – EURUSD


As the ECB came last week and messed up all the technical charts possible with the bearish statement calling for acting next time they meet in June, it is about time to re-evaluate the situation on the eurusd and check if there is still something there for the eurusd bulls.

Therefore, this scenario should be called, if you want, the last chance for eurusd bulls.

What we are having here is a daily chart that looks at the move from the 1.20 area to the upside and from my point of view it is still possible that the whole corrective wave following wave 1 blue to be a double three running, and this is ending almost always with a contracting triangle.

The triangle that you are seeing there is not a classical contracting triangle but a running variation of it, and the recent 1.3994 rejection comes from the apex of the triangle.

In such a triangle, the e wave should not end below 61.8% when compared with the previous d wave and this should be the stop loss, anywhere in the 1.3550/70 area.

The target on the other hand is more than generous as it implies 1.40 to come in a jiffy, considering the time frame.

And that should be just the beginning of a strong impulsive move to follow.

It remains to be seen if the markets will confirm it.

Monday, May 5, 2014

Taking Advantage of Missed Breakout Opportunities

Breakout trading is often associated with quick decision making and fast paced entries and exits, but it doesn’t have to be that way. Often times there are opportunities to get into a breakout trade well after the initial break. On top of that, there can be opportunities to enter into a breakout trade at a better price than what was originally presented. Today, we will discuss how to take advantage of missed breakout opportunities.
 
The Recent GBPUSD Breakout
The long term GBPUSD price chart is a prime example of a major breakout. We recently witnessed “cable” breaking to a multi-year high followed by a near-50 pip rally to breakout traders’ delight. If you were one of those breakout traders that participated, congrats. It was a good trade and I am happy it worked out for you. For the others that missed the break, don’t sweat it. These breakouts sometimes yield an opportunity to get in well after the initial break. Let’s take a look.
 
Trading the Breakout Pullback
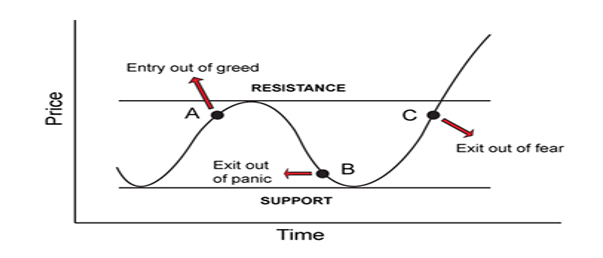
In order to qualify as a breakout, price must break through a support or resistance level. (Do you understand these terms? Test your knowledge by taking our Technical Analysis Quiz). But after this break occurs, price sometimes will pullback to the support/resistance level that was originally broken. The old saying, “What once was support, can later become resistance (and vice versa)” applies to this situation. Price can bounce off this level and produce a trading opportunity.
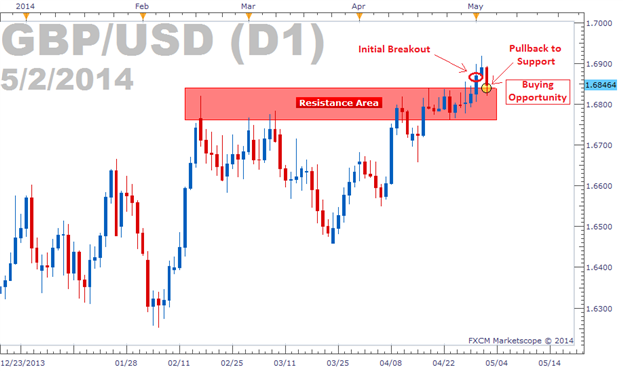
In the case for the current GBPUSD breakout, we’ve seen exactly this. Two days after the initial break, price has returned to its prior resistance level, giving us a buying opportunity. Our trade idea is based on the idea that this resistance level will now act as support. This scenario can be seen in the image below.
 
Learn Forex: GBPUSD Pulling Back to Support After Breaking to a Multi-Year High
Taking Advantage of Missed Breakout Opportunities
(Created using Marketscope 2.0 charting package)
 
So the initial break of the resistance area occurred two days ago, followed by another bullish blue candle. Today, GBPUSD fell heavily back towards the resistance area which now could act as support. This gives a buying opportunity (marked with a highlighted circle on the chart above) that actually gives us a better price to enter than the original breakout candle’s closing price.
 
Breakout Pullback Exit Plan
To exit this trade, we recommend using a 1:2 risk:reward ratio with a stop loss below the support/resistance area (around 1.6770) and a limit at least twice as far (around 1.6990). This will put our stop beyond the next closest support level and our limit underneath the psychological 1.7000 level. These orders should both reduce our risk and maximize our potential return from the trade. If you would like to explore other ways to exit this trade, check out my 3 Basic Ways to Exit Your Forex Trades.
 
Second Time’s a Charm
So next time we see a break out that we missed, know that it’s not a big deal. If we can be patient and wait for a pullback to the original support/resistance level, we can still get into the trade and possibly get in at a better price than what was originally available. This technique combined with a well thought-out exit strategy is worth testing using an FXCM demo account.

Friday, April 18, 2014

How Oscillators Can Show You If You’re Trading Against The Trend

Oscillators can be one of the most valuable tools in a trader’s arsenal. A big reason for its value is that very few tools can help you see a great risk: reward set-up when a price action correction is coming to an end. Put in other words, an oscillator helps you see the exhaustion of a move so that you can enter near the exhaustion point of a prior trend.
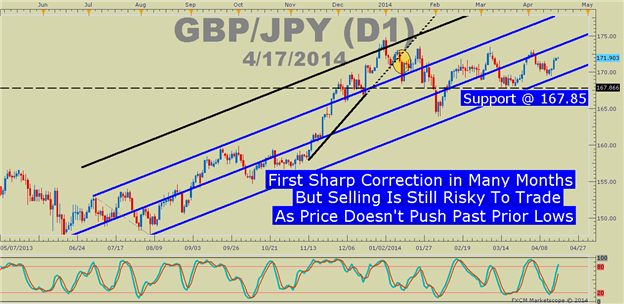
However, it would be a disservice to you if you were led to believe that a stretched oscillator was a great entry. Unfortunately, after many new traders learn about the benefits of oscillators, they believe they’ve received the golden key to trading profits and start buying low and selling high. A few steps back from the chart though and you’ll quickly see that only side of the trade is worth taking based on how price action reacts to an unwinding oscillator. 
 
Learn Forex: Trading With the Trend Is Always Preferable
Trading-Trends-With-Oscillators_body_Picture_3.png, How Oscillators Can Show You If You’re Trading Against The Trend
Courtesy of Marketscope 2.0
 
The Pain of Trading Against the Trend
The problem with trading against the trend is that it works every now and then. However, as a trader, it’s easy to agree with the words of John Maynard Keynes who said, “Markets can stay irrational longer than you can say solvent.” This sounds like someone who thought they had sold the top only to find they entered against a very strong trend that has no intention in stopping soon.
From talking to thousands of trader’s over the years, I’ve recognized a handful of reasons for trading against the trend. While this is not a definitive list, I’ve seen these three play out over and over again:
  • The excitement of being right while everyone else is wrong
  • The thought that the trend is overbought and due for a deep set-back
  • The feeling that the biggest money will be made on the big turn
It’s not wrong to feel this way. However, for most, it’s not profitable to trade this way and they’re falling prey to mental biases as opposed to good analysis. The reason that countertrend trading can be unprofitable for many to trade is because if you enter emotionally, you often exit emotionally. Exiting emotionally is a nice way of saying that you exit after a lot of your capital has been eaten up on a bad trade from the start. 
 
How Price Action & Oscillators Behave Counter-Trend
As you can see from the chart above, the oscillator often moved from extreme high to extreme low. Extreme lows are usually anything below 20 and extreme highs are usually anything over 80. Extreme highs are deemed to be overbought markets ready for a turn lower and extreme lows are deemed to be oversold and due for a bounce higher. 
 
Learn Forex: Find Out if Price Rises Proportionally To the Oscillator
Trading-Trends-With-Oscillators_body_Picture_4.png, How Oscillators Can Show You If You’re Trading Against The Trend
Courtesy of Marketscope 2.0
 
This chart brings a little more detail but the idea is clear. When you’re trading with an oscillator and you realize that price action is correcting disproportionally to the oscillator you’re trading against the trend. If you hold onto this type of trade then you could get steam-rolled when the oscillator unrolls back in the direction of the overall trend. Given the recent 500+ pip move in AUDUSD higher, if price unwinds disproportionally to the oscillator, then it may be best to get out of a short trade or consider rejoining the AUDUSD trend higher while managing your risk.
Now that you're armed with a new way to read trends with oscillators, feel free to try this information out on a FREE Forex Demo Account with access to multiple markets.

Thursday, April 3, 2014

Dollar Lining up for Major Moves as key Factors Favor Reversal

- US Dollar at major cyclical turning point, is strength ahead?
- A spike in forex volatility prices favors bigger moves in the days to come
- We’ll keep a close eye on the Dollar Index in particular as it bounces off key lows
The US Dollar continues to trade within a familiar trading range, but the coming week promises big currency moves. Why might this finally bring the Dollar break?
The beginning of the new week, month, and calendar quarter is a critical time for major financial asset prices. Why? Put simply, currencies and other assets are considerably more likely to establish new trends and trend reversals at the beginning of new calendar periods.
We can see this on a daily, weekly, monthly, quarterly, and yearly basis. As might be expected, the change of quarter and year is considerably more important than month, week, day, and so on.
Short-term FX volatility prices have likewise surged ahead of what promises to be a big week for economic event risk, and this in turn adds further weight to our argument for an important US Dollar reversal. 
 
Short-term Forex Volatility Prices Jump Ahead of Critical week for US Dollar
forex-US-Dollar-setting-up-for-major-moves-week-ahead_body_Picture_1.png, Dollar Lining up for Major Moves as key Factors Favor Reversal
Source: OTC FX Options Prices from Bloomberg; DailyFX Calculations
We’ll pay special attention to the trading range in the Dow Jones FXCM Dollar Index, as a hold of key lows suggests that the cyclical turn window may coincide with an important US Dollar bottom. 
 
Cyclical Turn Window Lines up with Dollar Bounce off of Key Lows
 
forex-US-Dollar-setting-up-for-major-moves-week-ahead_body_Picture_2.png, Dollar Lining up for Major Moves as key Factors Favor Reversal
Source: FXCM Trading Station Desktop, Prepared by David Rodriguez
From an automated trading strategy perspective, our outlook for trends leave us in somewhat of a “wait and see” mode. In short: we generally want to be positioned for Dollar strength, but markets likewise need to show themselves willing to push the Greenback strongly off of lows.
We’ll keep a close eye on US Dollar pairs in the week ahead. Sign up for future e-mail updates via my distribution list 
.
DailyFX Individual Currency Pair Conditions and Trading Strategy Bias
 
forex-US-Dollar-setting-up-for-major-moves-week-ahead_body_Picture_3.png, Dollar Lining up for Major Moves as key Factors Favor Reversal