Monday, May 12, 2014

The Three Keys of Day-Trading

1. Have your strategy (and plan) set before ever placing a trade
 
Do you already have a trading plan with your strategy written out? If you don’t, you should. While it may sound overly-detailed, or pedantic; the simple act of just knowing how you want to approach a market can have a massive impact on your overall approach.
Discipline is a necessary trait for any discretionary trader, and perhaps even more important for a short-term trader: But if you don’t know what you should do or how you should do it – how can you expect to have long-term success?
That’s where the trading plan comes in. This is like the trader’s ‘constitution’ as to how they’re going to operate and speculate in a market. This way, anytime a trader begins their operations for a day they already know how they want to attack the market, and they don’t have to make up a brand-new game plan every single morning.
If you want an example of a simple trading plan, we discussed that in the article How to Build a Four-Point Trading Plan; and if you’d like to go more in-depth, we covered that in The Trader’s Plan.
 
Various trader types, and example strategies for each
Trader Type
Sample Strategy
Scalper
Day-Trader
Swing-Trader
Intermediate-Term
Long-Term Trader
Position Trader
Taken from How to Build a Four-Point Trading Plan
 
2. Be selective – Trading is not entertainment
A key benefit of having the trading plan written out is that the strategy or mannerism for placing trades is already decided upon, and the trader simply has to look to execute as their strategy dictates.
If a trader takes a position that doesn’t fall within the plan or the strategy, well they know that it’s their fault for not following the plan. It’s an unfortunate truth, but in many cases the only way discipline can truly be learned is by seeing and feeling the ramifications of being undisciplined; and in trading, that amounts to losing money.
If you don’t feel that your trading plan is strong enough then change it; make it better. And if you need to build more confidence behind the strategy or strategies contained within the plan, do some testing until you get that confidence. With the availability and cost of demo accounts (free) – there is no excuse not to.
To speed things up, you can go through simulation with historical data to see how the strategy would’ve fared in the past. We discuss this process of ‘manual back-testing’ in the article, ‘Practicing the Art of Trading.’ That will allow you to get numerous simulations in a short period of time.
After that, you can take the strategy to a live demo environment… and once confident there; you can employ live capital behind the strategy that you know you want to be using in the quest for profitability.
I know that many traders, particularly new traders want to eschew this testing and building and formulating because, well it’s not all that much fun. But trading is not supposed to be entertainment. If you want entertainment, there are movies and music and all kinds of other things in this world to enjoy. Trading is a way to make (or lose) money.
Surely, there’s an emotional response that human beings get when placing trades… the potential to make or lose money brings on the excitement or thrill of ‘the chase.’
But losing money isn’t fun… making money is. Losing money is painful, costly, and psychologically-defeating. Over a long enough period of losing, most people will eventually abandon their efforts and look for greener pastures elsewhere (by quitting trading and giving up on their goals). And it’s all because that trader couldn’t control themselves enough to stick to their own plan.
Give yourself the best chances of success by choosing high-probability strategies that you’re confident in so that you can simply follow your own plan as opposed to ‘waking up in a new world every morning.’ 
 
3. Risk management is critical to short-term traders
One of the biggest misconceptions about trading is that winning percentages are the largest determinant of success. If you look at most other venues in modern-day society, winning is the only thing that matters.
In trading, this is somewhat deceiving; because the size of the losses versus the size of the wins takes on a huge level of importance. So much so that winning only 35-40% of the time could allow for profitability, while a trader winning 60 or 70% of the time could still be struggling while losing money (on net).
This was listed as The Number One Mistake that Forex Traders Make, and we explored this topic in-depth in the article, Top Trading Mistakes. In some currency pairs like GBPJPY, traders in the observed study won 2 out of 3 times (66% winning), yet they still lost money. And the reason for this is that the size of the losses was so large relative to the size of the average wins. If you want to learn more about that, please feel free to visit either of the aforementioned articles where this topic is explored in much more depth.
But many scalpers think or feel that looking for bigger rewards than risk amounts is simply impossible in the short-term; so they use wide stops and look to take ‘quick’ profits and they try to win 80 or 90% of the time. This doesn’t usually work out well. Why?
It’s because we can’t tell the future. No matter how strong your analysis, or strategy or trading plan – markets (and the future) will always be unpredictable.
Rather, trading is more about probabilities and trying to get the odds on your side, if even just by a little bit. And the shorter-term we get in our approach, the more unpredictable price action becomes. So short-term traders need to know how to lose properly, and when they do win, they have to look to maximize the potential of those scenarios. We talked about this topic in the article How to Reap Larger Rewards, in which we teach traders how to ‘scale out’ of winning positions after moving the stop on the trade to break-even.
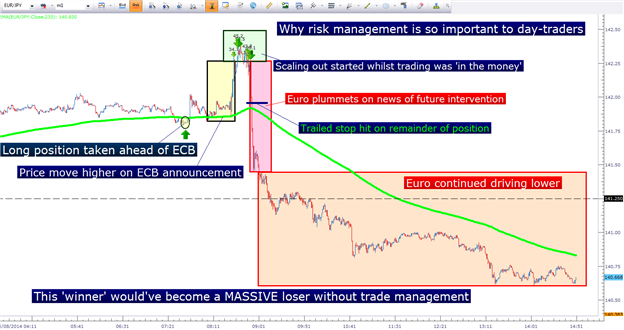
In the example below, we see how important trade management can be. In the earlier mentioned webinar, I had taken a long EURJPY position into the European Central Bank Announcement this morning. 
 
Risk Management Matters…
The Three Keys of Day-Trading
Created with Marketscope/Trading Station II; prepared by James Stanley
 
Initially, this worked out well as a lack of a movement in European interest rates saw the Euro fly higher. I used this opportunity to move my stop to break-even, and I began to ‘scale out’ of the position (closing pieces of the trade) while it was ‘in the money.’
As Mario Draghi took the stage for the ECB press conference, prices continued to surge, and I used this as an opportunity to scale out of more of the position.
But then something changed, and because I was hosting a webinar at the time I didn’t know exactly what it might be. But the Euro stopped moving higher and quickly began throttling lower.
I knew something was wrong… so I closed out the remainder of the long position at my trailed stop of +20 pips from my initial entry price. This saved me and allowed me to keep a profit on the position. And then the Euro just continued to fall.
If not for the trailed stop, and the scaling-out that I had done while my trade was ‘in the money,’ I’d be looking at a loss on this trade. But, trade management saved me.
The lesson to take from this is that markets are unpredictable, whether we have an open position or not. Greed and fear often govern our decisions, which is why having a plan is so important. But focusing on risk and trade management is what allows for a trader to plan, strategize, and strive for long-term success with a short-term approach in markets.

Tuesday, May 6, 2014

New Traders Beware


In today’s day and age of high speed computers, lighting fast financial information, and data overload, diving into the world of trading can be a frightening challenge for a newcomer to say the least. Add on top of that deciding which strategy to use and it’s no wonder why so many traders fail. You can choose the path of fundamental analysis where you will focus on economic and financial reports to make decisions. You can focus on conventional technical analysis which is loaded with price patterns, indicators, and oscillators, and more. Maybe you want to combine the two like some people do and spend 23.5 hours a day crunching data and looking at charts and about 30 minutes for eating and sleeping. An alternative approach to trading may be something you are already very good at, properly buying and selling anything. Let’s take a look at the various ways people attempt to trade the markets, including the core strategy we employ at Online Trading Academy. Let’s explore these to simply figure out what makes sense.
During a live online trading session from last week in the XLT (Extended Learning Track), we setup some trades for our students. The screen you see below is one of two that begins all of our trading sessions where we lay out the entire trade for students. It was a buying opportunity in a stock, EMC.

XLT

The trade was to buy EMC at 24.94 with a protective sell stop at 24.81 and a target at 25.40 and 25.77. The demand level we were planning on buying at is shaded in yellow. I assume there is more demand than supply at that price level because price could not stay at that level and rallied. I know that this can only happen because demand exceeds supply at that level. Another word for demand is “wholesale.” So, if I am a smart buyer and seller of anything, I know that when prices are at wholesale levels, I want to buy from someone who desires to sell at wholesale levels. Isn’t that how every business makes money?

The EMC Demand Zone

EMC
 
Live Trading Session – EMC Returns to Demand: Time to Buy

Lessons from the Pros

During the trading session, the trade met entry as price declined into that level. What that meant was that someone was convinced that EMC was worth selling at our wholesale price which meant we wanted to buy. Shortly after meeting entry, price rallied and met our two profit targets for a nice low risk gain. Our simple rule based strategy has us buying at price levels where demand exceeds supply (wholesale prices) and selling at price levels where supply exceeds demand (retail prices). This may sound as too simple and boring but that’s the way I choose to do it. Let’s take a look at some alternative ways of trading and in doing this, let’s look at the same trade through the eyes of conventional technical analysis with indicators and oscillators and such.
The charts below are the same two charts with the same trade only I have added some popular indicators and oscillators to it. With all this added information on the chart, you would think that we are able to make a smarter trading decision but think again. First of all, the hardest thing to see on the chart are the candles and that is the most important piece of information for me (obviously not for the conventional T/A trader). The reason why I believe none of these things I have added to the chart help a trader is because they all lag price. They will simply do what price has already done. This means that if we add any of these indicators to our core decision making process, we are simply adding risk and decreasing reward. The goal is low risk entries and big profit margins. Notice all the moving averages on the chart. Most people will only buy when they are sloping up. Notice that when price declined into our demand zone and it was time for us to buy, the moving averages were all sloping down. This will always be the case which is why conventional T/A traders always miss the low risk entry.

Lessons from the Pros

Next, notice all the other squiggly lines on the chart, they actually would have hurt us with losses and high risk entries. And, what about ATR, Average True Range (ATR). I have absolutely no use for this and feel bad wasting time writing about it but I will for your benefit if you’re trying to make this work. ATR shows you an average of the prior ranges in price. The thought is that this will tell you what future ranges will be to potentially help with risk management. But what if I gave you a choice and said I could teach you how to use conventional ATR which looks at ranges in the past or I could teach you how to identify what the future range will be, what would you want to learn? I am sure your saying “future” ranges as that is the key information we all want to know, I agree. Well, if you want to know what the range in the near future is going to be, measure the distance between a markets “fresh” demand and supply levels. If they are far apart, the range is “going to be” large. If they are close to each other in price, the range is “going to be” small.
As I have said before, you can learn the book version of trading if you want to but make sure you find plenty of people making money from reading the books first. Or, you can learn to trade by focusing on the reality of how markets work and how money is really made and lost in markets. This means quantifying real demand and supply in a market and then buying low and selling high, just like you do in every other part of life. Simplicity is the key for us in XLT.

Monday, May 5, 2014

Taking Advantage of Missed Breakout Opportunities

Breakout trading is often associated with quick decision making and fast paced entries and exits, but it doesn’t have to be that way. Often times there are opportunities to get into a breakout trade well after the initial break. On top of that, there can be opportunities to enter into a breakout trade at a better price than what was originally presented. Today, we will discuss how to take advantage of missed breakout opportunities.
 
The Recent GBPUSD Breakout
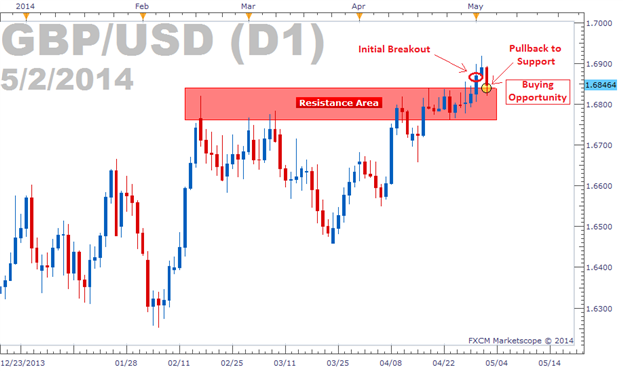
The long term GBPUSD price chart is a prime example of a major breakout. We recently witnessed “cable” breaking to a multi-year high followed by a near-50 pip rally to breakout traders’ delight. If you were one of those breakout traders that participated, congrats. It was a good trade and I am happy it worked out for you. For the others that missed the break, don’t sweat it. These breakouts sometimes yield an opportunity to get in well after the initial break. Let’s take a look.
 
Trading the Breakout Pullback
In order to qualify as a breakout, price must break through a support or resistance level. (Do you understand these terms? Test your knowledge by taking our Technical Analysis Quiz). But after this break occurs, price sometimes will pullback to the support/resistance level that was originally broken. The old saying, “What once was support, can later become resistance (and vice versa)” applies to this situation. Price can bounce off this level and produce a trading opportunity.
In the case for the current GBPUSD breakout, we’ve seen exactly this. Two days after the initial break, price has returned to its prior resistance level, giving us a buying opportunity. Our trade idea is based on the idea that this resistance level will now act as support. This scenario can be seen in the image below.
 
Learn Forex: GBPUSD Pulling Back to Support After Breaking to a Multi-Year High
Taking Advantage of Missed Breakout Opportunities
(Created using Marketscope 2.0 charting package)
 
So the initial break of the resistance area occurred two days ago, followed by another bullish blue candle. Today, GBPUSD fell heavily back towards the resistance area which now could act as support. This gives a buying opportunity (marked with a highlighted circle on the chart above) that actually gives us a better price to enter than the original breakout candle’s closing price.
 
Breakout Pullback Exit Plan
To exit this trade, we recommend using a 1:2 risk:reward ratio with a stop loss below the support/resistance area (around 1.6770) and a limit at least twice as far (around 1.6990). This will put our stop beyond the next closest support level and our limit underneath the psychological 1.7000 level. These orders should both reduce our risk and maximize our potential return from the trade. If you would like to explore other ways to exit this trade, check out my 3 Basic Ways to Exit Your Forex Trades.
 
Second Time’s a Charm
So next time we see a break out that we missed, know that it’s not a big deal. If we can be patient and wait for a pullback to the original support/resistance level, we can still get into the trade and possibly get in at a better price than what was originally available. This technique combined with a well thought-out exit strategy is worth testing using an FXCM demo account.

Thursday, May 1, 2014

Top Trade Idea For May 1st, 2014 – EURJPY


It is a while since we didn’t look at the eurjpy pair and I would say that right ahead of the NFP and ECB we are having an interesting technical setup.

What you see on the chart above is the 4h time frame on the pair and one thing that strikes the eyes is an elongated flat right at the beginning of the corrective wave and from that moment on we are looking for a possible contracting triangle as these formations appear as the entire leg of a triangle or only as part of a leg of a triangle.

I would say that wave a blue there is a triple combination that is followed buy a contracting triangle as a b wave blue or a double combination for the same wave. It really makes no difference as the outcome should be the same: two corrective wave should be followed by either an impulsive move to the downside, and in this case it is a flat we are looking for, or another corrective wave that should for the c wave blue of a contracting triangle.

In both cased price should move to the downside on a break of 141.14 level and the first target should be 140, the psychological level, while the second and final target should be anywhere between 138.50 and 139 levels.