Monday, April 28, 2014

Why Traders Lose Money

While the title of this article can have broad implications with numerous explanations, we’re going to do our best to reduce the answer to this query to the most logical and basic explanation.
When a trader first gets started, it might be hard to imagine how getting control of losses can seem an impossible task. It may even feel like the cards are stacked against you… situations in which you’re right in your analysis, yet you still lose on the trade and watch capital disappear from your trading account.
So, a natural question is why some traders consistently make money while others lose, even when they’re right. That is what we will be investigating in this article.
The Difference between Trading and Analysis
Many new traders come to the market with a bias or point-of-view. Perhaps this is built from a background in economics, or finance, or maybe just a keen interest in politics. But one of the biggest mistakes a trader can make is harboring the expectation that ‘the market is wrong and prices have to come back.’
But let’s face it: Markets are unpredictable, and it doesn’t matter what type of analysis you use. As new information comes into the market, traders and market makers price it accordingly; because these folks don’t want to lose money just as much as you don’t want to lose money.
Is this to say that analysis is worthless? Absolutely not: It merely means that analysis is only a part of the equation of being a successful trader. Analysis is a way to potentially get the probabilities on the trader’s side, even if just a by a little bit; a way to maybe get a 51% or 52% chance of success as opposed to a straight-up coin flip.
Good analysis, whether it be fundamentally-driven or technically-driven, can be right a majority of the time. But no form of analysis will ever be right all of the time. And this is the reason that there is such a large chasm between analysis and trading.
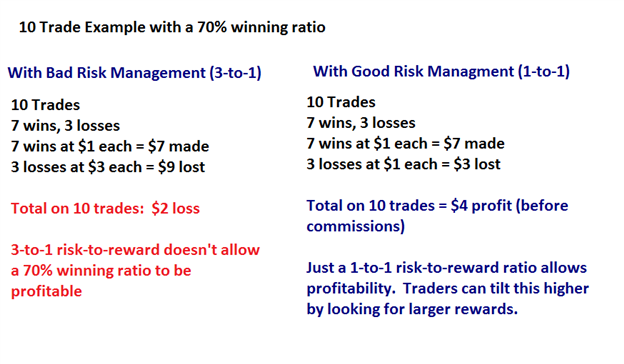
In analysis, it doesn’t matter how wrong you are when you aren’t right. In trading, this matters quite a bit. Because even if you’re winning on 70% of your trades, if you’re losing $3 for every trade in which you’re wrong but only making $1 every time that you’re right, you’re still losing. It might feel good, because 70% of the time you’re walking away from your positions with the feeling of success; and as human beings this is something we generally strive for (to feel good).
The example below shows how bad risk management can destroy even a strong winning percentage of 70% success.
Why Traders Lose Money
But logically, it doesn’t make sense to embark on this type of endeavor because the goal of trading is to make money; not necessarily to just ‘be right’ more than 50% of the time.
How to actually trade analysis
First thing first, traders need to crystallize what their actual goal is in trading in markets; and point-blank, that goal should be to make money.
After that, traders need to expect that they will, at times, be wrong.
So given these two facts, the next logical assumption is that without being able to control the damage from those instances in which we’re wrong, the prospect of profitability is a distant one.
So risk management isn’t just a preference or a style of trading: It’s a necessity for long-term profitability. Because even if you’re winning 90% of the time, the losses on the other 10% can far outstrip the gains that are made on the 90%.
I fully realize this isn’t necessarily exciting information. When I teach risk management, rarely do a see a student-trader ready to burst out of their seats to go and manage some risk. Most people want to hear about entry strategies, and analytical methods to try to get those odds of success tilted even higher in their favors.
But until a trader learns to manage their risk, much of this additional work is a moot point. Because as long as the risk exists that one bad position can and will wipe away the gain from many other ‘good’ positions; that trader is going to struggle to find profitability.
So, to properly trade analysis one needs to first observe proper risk management. Because trading isn’t just ‘guessing’ and ‘hoping’ that we get it right. Profitable trading is implementing analysis while properly managing risk factors; implementing a defensive approach so that when one is wrong, the losses can be mitigated and when one is right, profits can be maximized.
How can one begin to use ‘proper’ risk management?
We’ve already encountered one of the biggest mistakes of risk management, and that’s controlling the size of the losses relative to the size of the gains.
This was listed as The Number One Mistake that Forex Traders Make, and in the article The Top Trading Mistake, we looked at exactly how this problem can be so utterly damaging to new traders.
The solution is simple; implementing it not as much. As human beings, we often follow our gut instincts or our ‘feelings.’ But in trading, we have to keep the bigger picture in mind. When we place a trade, we often try to win on that one trade. This can keep traders holding on to losers for far too long, and closing out winners way too quickly.
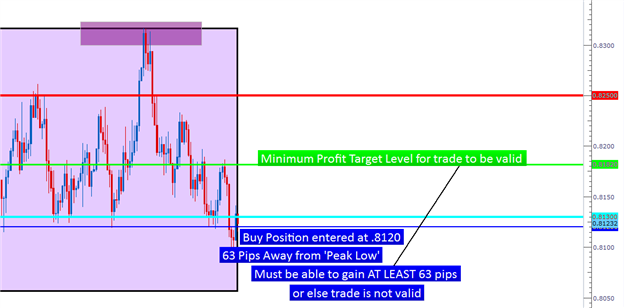
Traders can adjust strategies to focus on lower-risk, higher reward types of setups
Why Traders Lose Money
Image taken from How to Identify Positive Risk-Reward Ratios with Price Action; by James Stanley
The way to fix the Top Trading Mistake is to simply look to make more when you’re right than you lose when you’re wrong. That’s it. This can be done by setting stops and limits on every trade that is placed to reinforce that minimum 1-to-1 risk-to-reward ratio.
Unfortunately, risk management isn’t as simple as just setting a stop and setting a limit. After all, if a trader takes on a position that’s way too large relative to the size of their account, even if using a 1-to-2 or 1-to-3 risk to reward ratio; that one trade could completely wipe them out.
This is similar to the advice of ‘not putting all of your eggs in one basket.’ And while this concept is simple for equity investors that have seen stock prices fall off-of-a-cliff, highlighting the fact that investing in just one stock can be so dangerous, traders should look at the art of speculation in a similar light.
We discussed this topic in the article, Top Trading Mistakes, Part II: The impact of larger amounts of leverage. Not only does high leverage bring on a higher potential for failure, but highly-leveraged trades also amplify The Number One Mistake Forex Traders Make because more leverage amounts to even bigger swings in account equity.
We finished off the Top Trading Mistakes series with the third article, and this comes down to strategy selection. Even if a trader goes out of their way to prevent the top two trading mistakes, it doesn’t guarantee success. Holy Grail strategies don’t exist, and the best that a trader can do is to look to employ an approach befitting of that particular market’s condition.
If you’d like an example of how this can be done, the article How to Catch Swings in the Forex Marketshowed how traders can look to trade short-term reversals or swings with a constant eye on risk management.

Tuesday, April 22, 2014

2 Ways to Trade a 2500 Pip Trend, Part 2: Fear of the Unknown

This is the second part of a 2 part series on trading strong trends. The first part was devoted to using a retracement strategy on the EURNZD which has been in a strong down trend for the past 11 months. Yesterday, prices did push into the resistance retracement zone. Therefore, retracement traders may be inclined to enter a position based on selling at resistance.
However, in our DailyFX Plus webinars, we frequently hear from traders who are apprehensive to place entries into the market because they fear the unknown price movements into the future. What if the strong trend ends?
That is a common emotion felt by many traders. Utilizing a break out strategy can help alleviate some of those pressures as you let the market dictate to you if it is ready to resume the trend.
A breakout is simply selling at support and buying at resistance. There are many different ways of determining support and resistance. Today, we will look at a simple method of identifying entry and exit points by using the Donchian Channel Indicator.
 
2_Ways_to_Trade_a_2500_Pip_Trend_part_2_body_Picture_1.png, 2 Ways to Trade a 2500 Pip Trend, Part 2: Fear of the Unknown
(Created using FXCM’s Marketscope 2.0 charts)
 
Here is a summary of the rules to the strategy.
  1. Filter your trades in the direction of the daily trend. We determined in Monday’s report that this trend is a strong one to the downside. Therefore, we will look to sell.
  2. Add the Donchian Channel Indicator to a 2 hour chart. Input value is 55 periods.
  3. Place an entry order to sell 1 pip below the lower Donchian channel.
  4. Place a stop loss order at the upper Donchian channel. Manually trail your stop loss so that it follows the upper channel.
  5. Exit the trade when price reaches the upper Donchian channel.
The benefit of using this strategy is that if the trend re-emerges to the down side, the market trips the entry and places you in the trade. By trading to a new low, the market is essentially stating it is ready to trade to levels not seen in quite a while. In the case of the EURNZD, it would be trading at all-time lows and therefore, furthers the case that it is in a strong trend.
Also, another benefit of a breakout strategy is that it can keep you out of some losing trades (“Breakouts: How to Stay Away from Some Losing Trades”). So there are several advantages to implementing a breakout type of strategy. The downside to the strategy is that you are entering a sell trade at a lower price and therefore, entering the trade late.
In closing, when you find yourself facing the fear of the unknown in a strong trend, consider implementing a breakout strategy. Inside DailyFX Plus LIVE CLASSROOM, we frequently discuss breakouts and how to trade them.

Monday, April 21, 2014

2 Reasons to Sell US DOLLAR

TheDow Jones-FXCM U.S. Dollar Index (Ticker: USDollar), has been quietly putting in a series of lower highs and lower lows for the past four months. Though this downtrend has been in force for a while, we believe there is still one more opportunity to sell the Greenback with a good risk to reward ratio.
Here are two technical reasons the USDOLLAR may continue to slide.
 
SSI Shows Retail Traders are Currency Buying USD
FXCM’s Speculative Sentiment Index (SSI) is a sentiment reading much like the COT report in futures trading or the Put/Call ratio in equity trading. SSI is a good contrarian indicator such that when a large number of traders are already positioned in a pair to one side of the trade AND if they are trading against the trend, more often, they end up being wrong on the trade.
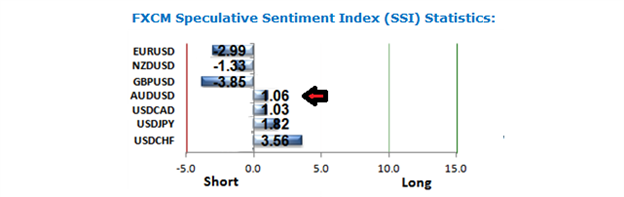
In this case, traders are significantly positioned as US Dollar buyers. Since the trend has been towards USD weakness, these traders are fighting the trend. SSI is giving us a broad based signal that USD weakness is likely to continue.
2 Reasons to Sell USDOLLAR
Taken from FXCM’s SSI reading April 21, 2014
 
In the chart above, you’ll see how traders are positioned for Greenback strength in all of the majors, except the AUDUSD. For example, the EUR/USD shows a ratio of -2.99. This means there are nearly 3 traders short the EUR/USD for every trader who is long.
With this much broad sentiment based towards US Dollar strength, the contrarian reading suggests the US Dollar is likely to continue getting weaker.
(See FXCM’s SSI readings twice per day inside DailyFX Plus with your live account username and password. If you don’t have a live FXCM account, then you can subscribe monthly.)
 
Using Wave Relationship to Guide our Trade
The second technical reason to sell the Dollar is based on Elliott Wave analysis.
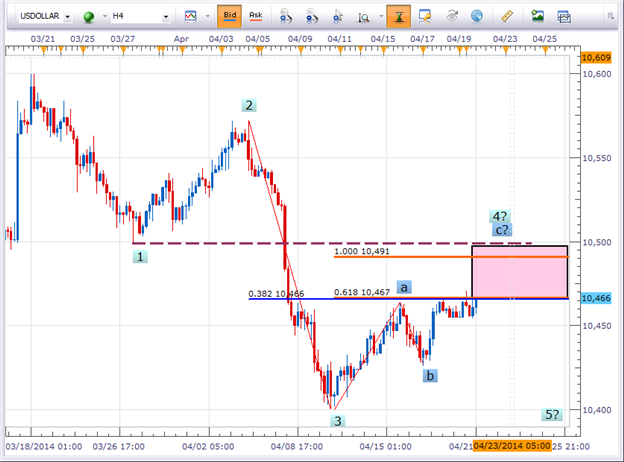
When looking at the waves of the USDOLLAR chart, prices have aggressively sold off in late March and early April 2014. It is possible that those moves down were waves 1 and 3 of a five wave sequence. If this is the pattern, then we are currently in a wave 4 counter trend retracement higher which will eventually give way to a fifth and final wave lower.
Elliott wave is a challenging type of technical analysis. Though it is difficult to learn, the benefits of even understanding it at a basic level can help you identify points on the chart to place a stop loss and take profits.
 
Forex Education: Completing the 4th wave of a 5 wave sequence
2 Reasons to Sell USDOLLAR
(Created using FXCM’s Marketscope 2.0 charts)
 
One of the rules in Elliott Wave is that wave 4 cannot enter into the territory of wave 1 in a five wave impulsive move.
If the labeling on the chart above is correct, then that means that wave 4 would not enter into the low from March 27 (see purple dotted line). If it does, then the labeling on this chart is incorrect and some other pattern is developing.
We can also use wave relationships to identify if we are getting close to an ideal entry point.
In a three wave corrective move (see the dark blue a-b-c labels above), wave c oftentimes has a length relationship to wave a. As we can see above, the orange horizontal lines illustrates where the length of wave c is 61.8% the length of wave a, a common relationship.
Also, a typical stopping point for wave 4 is at a 38.2% retracement of wave 3. Adding our Fibonacci retracement levels to the chart, we see that the 38.2% retracement of wave 3 is near 10,466.
As you can see, both the orange and blue lines are VERY close to one another. This strong wave relationship is part of the reason why prices are having a hard time moving higher.

Another wave relationship guideline is that wave 5 tends to have a wave relationship with wave 1 in terms of equality. Said another way, the size of wave 5 tends to equal the length of wave 1. That would mean wave 5 would modestly surpass the end of wave 3 and fall into the 10,375-10,400 zone.
Since this is the pattern we are favoring right now, we can enter the trade with a stop loss 1 pip above the low of March 27 (the low of wave 1). That means the stop loss on the trade would be placed at 10,500.
If we enter near the current market price and look to take profits near 10,400, that means our trading opportunity would have a 1:2 risk-to-reward ratio.
For those account holders who reside outside of the United States, you can place this trade through the USDOLLAR instrument. You should be able to see this appear on your platform.
For residents inside the United States, you can place a basket trade. There are several benefits to trading a currency rather than a pair. The Mirror platform allows you to place a US Dollar Sell Basket with one click. You can register for a free Mirror practice account if you would like to try it out.

Saturday, April 19, 2014

How to Match Your Personality with Your Forex Trading Strategy

If you’re having trouble sticking to your forex strategy, then you might need to figure out if your personality matches your trading style. In his book, “Mechanical Trading Systems: Pairing Trader Psychology with Technical Analysis,” author Richard Weissman identifies three basic trader personality profiles: trend-following, mean-reversion, and day-trading types.


Are you a trend-following trader?

Weissman enumerates two traits necessary for successful trend-followers: patience and fortitude. Trend-following mechanical systems attempt to catch strong directional moves, with signals forming when the trend has already begun. A typical entry strategy may be to buy at recent highs or sell at recent lows, in anticipation that the price will make a new high or low later on. This may seem counter-intuitive to the majority of traders who like to pick “tops” and “bottoms,” but that’s what sets trend-followers apart from the rest.

The strength of this method is that if you catch a strong trend, you can come up with huge winning trades relative to your initial risk. But of course, no system is fool proof and there are tradeoffs to grabbing potentially big wins.

As the saying goes, “markets range 70-80% of the time.” That means catching a strong trend can be rare, and sticking to a trend-following system requires that you endure several small losses when your entry signals have you jumping in when the market consolidates or pulls back.

To be a trend-following trader you must be comfortable with potentially having a low win ratio, but as long as your winning trades generate enough profits to outpace your losses, then that’s all that matters.

So the questions you have to ask yourself are: Do I have the mental fortitude to handle more losses than wins? Do have the patience to ride the winning trades to their full profit potential? If you answered “yes” to both questions or if you feel stressed having to come up with numerous trade decisions in a day, then trend-following mechanical systems may be the right entry/exit method for you.

Are you a mean reversion trader?

In terms of price action, the mean reversion theory states that on average, markets are more often trading within a range than trend. When the market goes beyond its average range of historical volatility, it tends to fall back to the middle of that range, or the “mean.” These systems aim to look for probable reversal points (i.e. tops and bottoms) where price movement could change direction.

The major difference is that while trend following systems aim to “ride the trend” for large profits, mean reversion systems normally have an exit in mind based off key support or resistance levels. This means a lot more smaller winning trades.

A couple of indicators used in mean reversion systems are the ADX and Stochastic. The ADX helps identify whether the market is in a trend or rangebound, while the Stochastic indicates potential overbought and oversold conditions that tend to precede a reversal.

The key to utilizing a mean reversion system, especially during the long-term timeframes, is maintaining rock solid discipline. Using this method could put you in the market against a strong trend, which can be psychologically difficult if it doesn’t turn your way. Also, there can be many distractions and obstacles that cause psychological stress for a trader, such as the media and other traders. You must train yourself to follow your system’s rules no matter what and remember that the strength of a mean reversion system is the high probability that markets will stay in a range.

Are you a day trader?

Lastly, we have day trading systems. These can be trending or mean reversion systems, but on a shorter time frame–Weissman cites that these generate signals for trades that last 10 days or less. Market junkies who have a knack for these kinds of fast-paced systems usually look at the hourly time frame or lower to aim for smaller profits and place tight stop losses.

According to Weissman, mechanical systems benefit short-term traders the most as the frequency of making trade decisions arise. By using a mechanical system that already outlines what entry and exit levels to take with pre-determined risk-reward ratios, a day trader is somehow relieved from stress.

However, this is not to say that intraday systems are all sugar, spice, and everything nice. The biggest drawdown to using them is that they are labor-intensive. Traders have to be glued to their screens during trading hours either to be ready to act on valid signals or to monitor/adjust their trades.

Dealing with potentially volatile intraday market action, a trader must be able to quickly make sound decisions. Mental agility is critical for someone to master day trading systems and if you think that you have the capacity to find Zen amid the chaos, you may want to try out an intraday system.

So what’s your trading personality?

You have to remember that regardless of what kind of system you’re using, the market will always find a way to put you between a rock and a hard place. There will be times that you will have more losers than winners, trades go quickly against you, or you’ll have to let go of some of your unrealized profits, but knowing what you are comfortable with and finding the system or method that matches your personality will help you better adapt to the always-changing market environment.

Check out our trading personality quizzes (No, we did not pull these off Cosmo! Only Big Pippin reads that, but don’t tell him I told you his little secret!) to figure out if your personality matches your trading strategy.