Talking Points:
- NZD/USD Technical Strategy: Flat
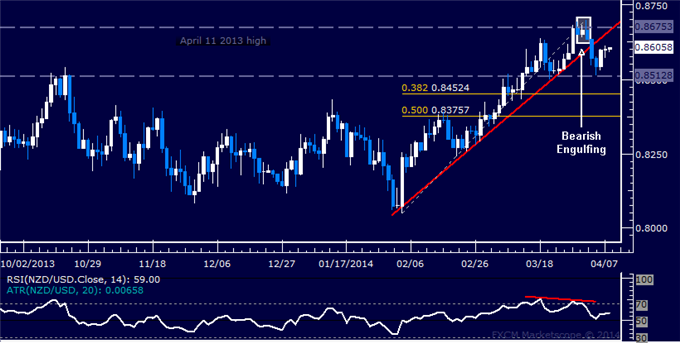
- Support: 0.8513 (Oct 22 close), 0.8452 (38.2% Fib ret.)
- Resistance: 0.8662 (trend line), 0.8675 (Apr’13 high)
New Zealand Dollar fell against its US namesake as expected
after the pair produced a Bearish Engulfing candlestick pattern below
resistance at the April 2013 high (0.8675). Prices have since rebounded
from support at 0.8513, the October 22 close, with a further advance
above trend line support-turned-resistance at 0.8662 targeting for
0.8675 once again. Alternatively, a breach of support exposes the 38.2%
Fibonacci retracement at 0.8452.
A Head and Shoulders top may be in the works, with
0.8513 serving as the pattern’s neckline, but confirmation is absent for
the time being. We will stand aside for now, monitoring the pair for an
actionable trade setup.
Daily Chart - Created Using FXCM Marketscope 2.0
No comments:
Post a Comment