The U.S. dollar pared gains against the yen on Monday after Federal Reserve Chair Janet Yellen struck a dovish tone on the economic outlook, while disappointing U.S. manufacturing data also weighed on the market.
Yellen’s comments came at the Development conference in Chicago, where she said that “considerable slack” still remained in the labor market and reiterated that the Fed’s commitment to economic stimulus will still be needed for some time.
While today’s data showed that manufacturing activity in the Chicago region expanded at a slower rate than forecast in March, as new orders fell.
The Chicago purchasing managers’ index fell 55.9 from 59.8 in February. Analysts had expected the index to tick down to 59.0.
During the U.S. session the dollar backed off more than a two-week high against the yen, with USD/JPY closing up 0.35% at 1.0320, down from a high of 1.0344 earlier.
In Europe the single currency had a topsy turvy session, weakening in the morning after preliminary data showed that the annual rate of inflation in the euro zone fell to the lowest level since November 2009 in March.
The shock drop raises expectations the European Central Bank will take radical action to stop the threat of deflation in the currency bloc at its upcoming policy meeting on Thursday.
However, some investors expect the ECB to leave monetary policy on hold on Thursday, after Bundesbank head Jens Weidmann said Saturday that the euro zone is not in a deflationary cycle, and that the slowdown was due in large part to temporary factors, such as falls in food and energy prices.
The euro recovered later in the session, after Fed Chair Yellen’s dovish comments about the U.S. economy. EUR/USD ended the session up 0.16% at 1.3775, up from a low of 1.3724.
In the U.K. the pound took advantage of this mornings Chicago PMI miss, climbing to more than two-week high against the dollar. With GBP/USD closing up 0.22% to 1.6676.
Elsewhere, the New Zealand dollar gained on the U.S. dollar after Yellen’s dovish comments, despite data showing that the ANZ business confidence index for New Zealand slipped to 67.3 in March, from a reading of 70.8 the previous month.
NZD/USD ended the session up 0.18% to 0.8672.
While the Australian dollar remained close to a four month high against the greenback, with AUD/USD climbing 0.25% to 0.9271.
Finally, the Canadian dollar strengthened after official data showed that Canada’s economy expanded 0.5% in January, ahead of expectations for growth of 0.4%.
On a year-over-year basis, Canada’s economy expanded 2.5% in January, following growth of 2.4% in the preceding month.
USD/CAD ended the session down 0.11% at 1.1048.
Monday, March 31, 2014
Sunday, March 30, 2014
Big Move Ahead as Euro’s Fate Depends on Outcome of ECB Meeting
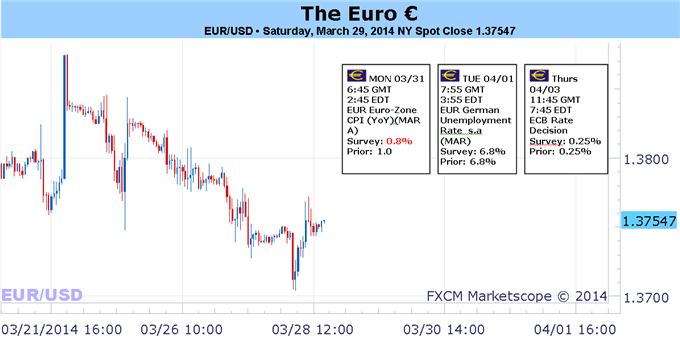
Fundamental Forecast for Euro: Neutral
- The Euro’s vulnerability was on full display this week.
- Shifting fundamental momentum sees the Euro losing key support to the Australian and US Dollars.
- Have a bullish (or bearish) bias on the Euro, but don’t know which pair to use? Use a Euro currency basket.
The European Central Bank’s dovish rhetoric show hit
the road this week as policymakers continued the pushback against the
perceived hawkish nature of the March policy meeting. Several different
policymakers commented on the fragmented state of Euro-Zone credit, the
impact of the elevated Euro exchange rate on inflation, and the prospect
of additional non-standard easing in the months ahead. The timing
couldn’t be more calculated with the central bank set to gather once
again this coming Thursday.
It’s been made clear in the past two weeks, however,
that ECB policymakers are viewing the actions taken at the March
meeting as far too hawkish. There has been considerable pushback from ECB officials everywhere, including from ECB President Mario Draghi
and Bundesbank President Jens Weidmann. The fact that two of the more
patient, monetarily conservative members have softened their tone is a
strong indication that the ECB feels it may have made an errant signal
to the market.
We’ve long argued that the ECB would withstand the
calls for further easing as crisis conditions remained absent and
economic data steadily improved. This has been the case, which is why
the ECB has done little but for a meager 25-bps rate cut in November.
Sovereign yields remain at or near multi-year lows across the continent –
Germany, Italy, Spain, Portugal – but now there are signs that funding pressures may be building.
Excess liquidity in the Euro-Zone has dropped to €104B, the lowest
level since before the first LTRO in December 2011, which has started to
put more pressure on interbank lending rates.
A look at EONIA shows conditions have tightened
further the past week. The interbank rate settled at 0.174% on Friday,
just above the 20-day average EONIA rate at 0.170%; up from 0.157% one-month early (February 28), and up from 0.155% three-months earlier (December 27).
We point to the ECB’s Asset Quality Review (AQR) as a source of
apprehension – there is little logic to taking on more risk amid the
first ECB-led stress tests.
The difference between where we stand today from
say, the eve of the ECB’s March meeting, is that the economic data
climate has worsened noticeably, undercutting the one true source of
stability for ECB policy. There were surprisingly low inflation readings out of two of the Euro-Zone’s largest economies at the end of the week (Germany and Spain), and it
is very possible that the flash Euro-Zone inflation report on Monday
shows yearly inflation down to a +0.5% y/y or +0.6% y/y pace, either of which would be a post-2008 crisis low.
The Citi Economic Surprise Index fell to a fresh 2014 low this week,
hitting -7.4 on Wednesday and settling at -3.8 on Friday, its lowest
weekly closing level since November 1, 2013 (-3.8) – the ECB cut its
main refinancing rate just six days later at its November policy
meeting. The sudden downswing in growth momentum, alongside the soft
inflation environment, has elevated the likelihood of further dovish
action by the ECB this week. The time for ECB action may be nearing, but with speculation building that something might happen – EUR
long contracts were reduced by -25.6% this week, per the CFTC’s COT
report – a lack of a concerted policy response could just as easily send
the Euro back towards its yearly highs. –CV
Saturday, March 29, 2014
Bitcoin Prices Hug $500 in Rangebound Weekend Trading
Bitcoin prices are trading close to the important $500 support level
this weekend. Earlier in the day, BTC/USD hit a high of $506.91 on BTC-E before
pulling back. The lowest low this Saturday stands at $492.52. The fledging
virtual currency is currently trading at $499.80 on BTC-E, compared to $498 on
BitStamp.

There is still no official reaction from the People’s Bank of China on
the deposit ban rumors posted two days ago. Charlie Lee, CEO of BtcChina was
quoted as saying that, if the initial notice by the PBOC was meant to be kept
private, we may never get an official confirmation of its validity by the Bank.
However not all jurisdictions are hostile to bitcoin. The Financial
Supervision Commission of the Isle of Man, a self-governing British Crown
dependency, just issued a favorable ruling on cryptocurrency regulation. According to the new rules, a bitcoin
exchange that holds client funds with a licensed overseas payment service
provider is not required to obtain a license in the country. The commission
however warns potential investors that: ‘’it is possible legislation could
be amended in the future to bring the proposed activities within regulated
activity and/or to make the activity subject to the AML Code and thus subject
to the draft Designated Businesses (Registration and Oversight) Bill 2014’’.
The Isle of Man boasts a low tax burden compared to its neighbors.
Individuals are taxed at 20% to a maximum of £115,000 per year, £230,000 for
couples if they choose to have their incomes jointly assessed. Most businesses pay no corporate
tax, banks pay 10%.
How to Trade a Triangle after a False Breakout
Talking Points:
- GBPJPY broke out of a 967 pip symmetrical triangle that had a target over 180.00
- The advance from the breakout point of 171.13 was halted at 173.56 and price turned down
- A new triangle can be drawn taking into account the new swing points created by the false breakout
Forex symmetrical triangles are important price
patterns relied on by traders to identify periods of consolidation ahead
of an anticipated large breakout. Traders like using triangle price
patterns because they have risk to reward parameters which are easy to
determine from the pattern itself.
Not only can the stop be placed just outside the
pattern, but a limit can be determined by measuring the height of the
pattern and projecting this distance in pips from the breakout point.
This is called a measurement objective.
Thomas Bulkowski in his book, Encyclopedia of Chart
Patterns stated that symmetrical triangles meet their upside targets 66%
of the time. However, the recent GBPJPY triangle that was posted in my March 4th 2014 article was part of the 33% of triangle breakout failures.
Learn Forex – GBPJPY Symmetrical Triangle False Breakout
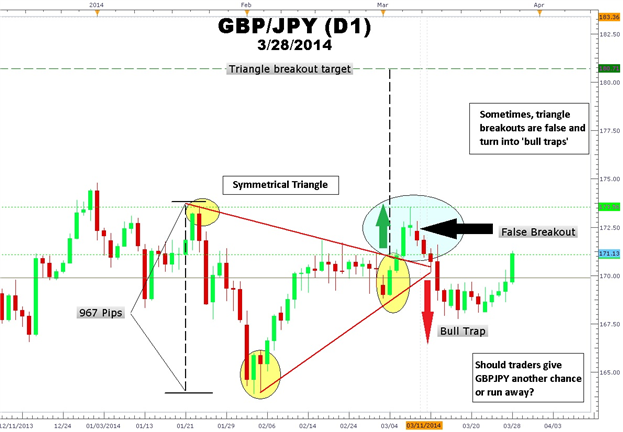
(Created using FXCM’s Marketscope 2.0 charts)
As you can see in the chart above of the GBPJPY
symmetrical triangle, a breakout happened at 171.13. Initially, wide
ranging candlesticks breaking above the top of the symmetrical triangle
may have led traders to believe the up move had more to go. However,
the doji candlestick pattern was joined by a bearish candlestick forming
a Japanese candlestick evening star pattern at 173.56 capped this
rally.
From this point, we can see an acceleration in
bearish price action as a series or red candlesticks form Bullish
breakout traders are now caught in what is called a “bull trap” in the
167.60 area. Stops are triggered and longs are shaken out. Today, we see
a strong surge in yen weakness and GBPJPY rebounds. The question now is, “Should traders give GBPJPY another chance?”
Learn Forex – GBPJPY Daily Chart Revised Symmetrical Triangle

(Created using FXCM’s Marketscope 2.0 charts)
A New Triangle Emerges
If the fundamental and technical reasons that
existed when the trade was made still exist after a stop out, then we
would consider re-entering the trade. However, forex triangle traders
may make modifications to the initial triangle in order to take into
account the new swing highs and swing lows.
First of all, the new swing high which was created
by the false breakout is connected to a higher previous high. Next, the
new swing low which was created by breakout below support is connected
by an upward sloping trend line from the previous swing low. The result
is a new symmetrical triangle with new buy and sell parameters. New
limits are set as well.
How to Trade this New Triangle
The breakout method for trading a symmetrical
triangle has not changed. However, the triangle has become bigger.
Despite the big GBPJPY big 350-pip run-up today to 171.05, GBPJPY is
another 250 pips from making a confirmed triangle breakout. Triangle
resistance is at 172.70 area making a long GBPJPY trade too early of a
proposition now.
If and when GBPJPY trades above 173.56, a stop can
be placed beneath the last swing low of the triangle at around 167.40
with an upside target of 183.91. On the other hand, a close below 167.40
would trigger a sell signal for a bears to trade the triangle south
with a target of 156.75.
After the last false breakout, traders may ask
GBPJPY to “show them the pips” with a confirmed triangle breakout before
going long GBPJPY a second time
Friday, March 28, 2014
Top Trade Idea For March 28th, 2013 – AUD/JPY
Train Leaving the Station
One of the first tips new traders receive is “the trend is your friend”, but even experienced traders can find it difficult to join a well-established move. How many times have you heard a trader say “it’s gotta come back!”?
Overcoming the human mean reversion bias is a lot easier when there is a clear entry signal. This brings us to AUD/JPY.
In April, the Japanese government will lift the retail sales tax rate from 5% to 8%. The rate of money supply increase in Japan has slowed this year, despite the well flagged stimulus program. One plausible explanation is that the BoJ is holding back capacity to better offset any drag from the tax increase – meaning that increased stimulus efforts (and a weaker Yen) may be around the corner.
On the other side of the pair, AUD strength is harder to explain in fundamental terms. Everyone from the Governor of the RBA to my taxi driver last night is expecting a lower Aussie. It appears market positioning is driving the corrective rally underway. The ongoing cries of disbelief suggest this may have a while to run yet.
Here’s the chart:

Screen Shot 2014-03-28 at 7.06.18 AM
This is a clear break above previous highs. A short term trade may involve buying at current levels, with a stop below 94.50 and a target near the 6 month high around 95.67. However, the 2013 high is above 105 (!!!), and traders seeking longer term, higher value trades may consider a stop loss below the 94.00 support and a trailing stop loss (rather than a target) on any move through 95.67.
One of the first tips new traders receive is “the trend is your friend”, but even experienced traders can find it difficult to join a well-established move. How many times have you heard a trader say “it’s gotta come back!”?
Overcoming the human mean reversion bias is a lot easier when there is a clear entry signal. This brings us to AUD/JPY.
In April, the Japanese government will lift the retail sales tax rate from 5% to 8%. The rate of money supply increase in Japan has slowed this year, despite the well flagged stimulus program. One plausible explanation is that the BoJ is holding back capacity to better offset any drag from the tax increase – meaning that increased stimulus efforts (and a weaker Yen) may be around the corner.
On the other side of the pair, AUD strength is harder to explain in fundamental terms. Everyone from the Governor of the RBA to my taxi driver last night is expecting a lower Aussie. It appears market positioning is driving the corrective rally underway. The ongoing cries of disbelief suggest this may have a while to run yet.
Here’s the chart:
Screen Shot 2014-03-28 at 7.06.18 AM
This is a clear break above previous highs. A short term trade may involve buying at current levels, with a stop below 94.50 and a target near the 6 month high around 95.67. However, the 2013 high is above 105 (!!!), and traders seeking longer term, higher value trades may consider a stop loss below the 94.00 support and a trailing stop loss (rather than a target) on any move through 95.67.
Scalps Favor Selling Rallies in EURAUD Post Head and Shoulders Break
Talking Points
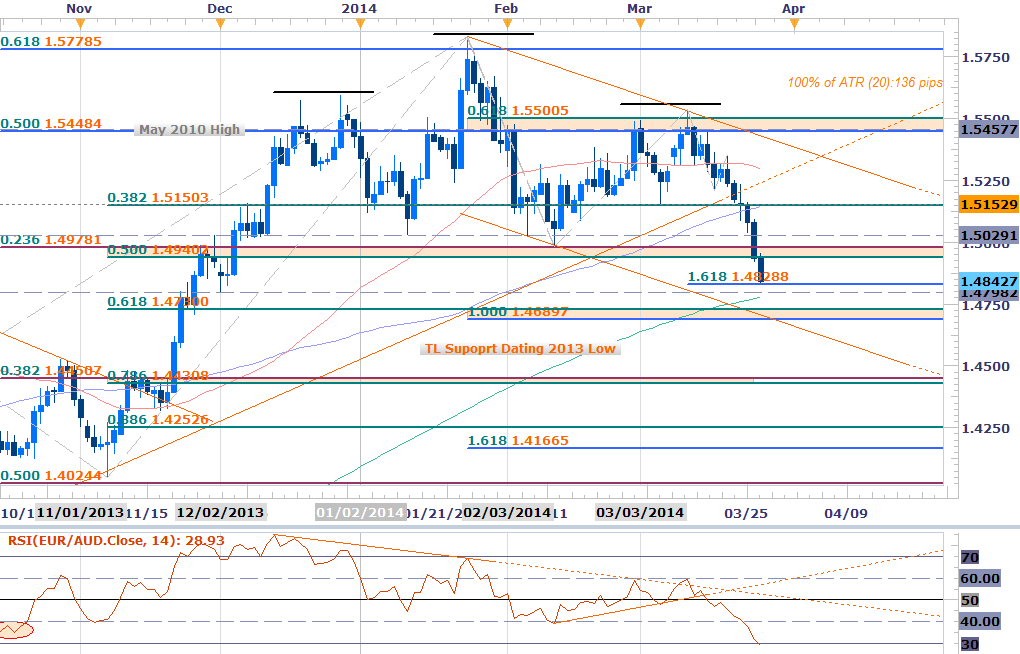
- EURAUD Breaks below weekly & monthly opening ranges- Bearish
- Broader head and shoulders break shifts medium-term outlook lower
- Event risk on tap from Europe and Australia heading into month end
EURAUD Daily Chart

Technical Outlook
- EURAUD breaks below March opening range low 1.5150- Bearish
- Key support break at 1.4940/78 puts Head and Shoulders formation in play
- Support objectives at 1.4829, 1.4690-1.4730, 1.4430/50, 1.4253
- Bearish below 1.5030, 1.5150- Bullish Invalidation
- Daily RSI hold at 60 & subsequent 40 break- Bearish
- RSI signature at lowest level since March of 2013
- Event Risk: German CPI & Eurozone Confidence data tomorrow and RBA Interest Rate Decision on Tuesday
EURAUD Scalp Chart
Notes:
The EURAUD has made an impressive move this week with the pair breaking
below the March opening range defined by the 38.2% retracement of the
November advance at 1.5150. A weekly opening range break below 1.5085
further supported our near-term bias with the immediate focus remaining
on the short-side below this level.
Bottom line: The pair has now completed a 1.618%
extension off the decline from the monthly high and although this may
offer some interim support, we’ll look to sell rallies / breaks of
support while below 1.5030 with only a breach above this week’s high
challenging our broader outlook. Note that a larger head and shoulders
formation on the daily chart is in play here with longer-term objectives
eyed around 1.4250.
Stay nimble heading into Eurozone data tomorrow
morning with the RBA interest rate decision early next week likely to
fuel added volatility in the pair. Keep in mind that the close of the
month and quarter is upon us with the April and weekly opening range
likely to offer further guidance on our near-term scalp bias. Follow the
progress of this trade setup and more throughout the trading week with DailyFX on Demand.
* It’s extremely important to give added consideration regarding the timing of intra-day scalps with the opening ranges on a session & hourly basis offering further clarity on intra-day biases.
Key Threshold Grid
|
Entry/Exit Targets
|
Timeframe
|
Level
|
Significance
|
|
Resistance Target 1
|
30min
|
1.4915
|
Soft Resistance / Pivot
|
|
Resistance Target 2
|
30min
|
1.4955
|
Soft Resistance / Pivot
|
|
Resistance Target 3
|
Daily / 30min
|
1.4978/84
|
23.6% Retracement / February Low
|
|
Bearish Invalidation
|
Daily / 30min
|
1.5010/30
|
61.8% & 100% Extension(s)
|
|
Break Target 1
|
30min
|
1.5085
|
Weekly ORL
|
|
Break Target 2
|
Daily / 30min
|
1.5148/55
|
61.8% Ext / 38.2% Retrace / 100DMA / March ORL
|
|
Break Target 3
|
Daily / 30min
|
1.5221
|
100% Ext / Weekly ORL
|
|
Support Target 1
|
Daily / 30min
|
1.4829/55
|
1.618% & 2.618% Ext(s)
|
|
Support Target 2
|
Daily / 30min
|
1.4798
|
December Low / Pivot
|
|
Support Target 3
|
30min
|
1.4774
|
200DMA
|
|
Bullish Invalidation
|
Daily / 30min
|
1.4690 – 1.4730
|
61.8% Retracement / 100% Ext
|
|
Break Target 1
|
Daily / 30min
|
1.4550
|
October High
|
|
Break Target 2
|
30min
|
1.4502
|
2.618% Extension
|
|
Break Target 3
|
Daily / 30min
|
1.4430/50
|
78.6% & 38.2% Retrace(s) / August Low
|
|
Break Target 4
|
Daily / 30min
|
1.4253
|
88.6% Retrace / H&S Objective
|
|
Daily (20)
|
136
|
Profit Targets 31-34pips
|
|
*ORH: Opening Range High
*ORL: Opening Range Low
Thursday, March 27, 2014
Top Trade Idea For March 27th, 2014 – USDCHF

The overlapping between the second and fourth waves is there, the alternation is there, the extension is there, all in one simple pattern.
Now, the question is if it is completed or not, and what to do and how to trade it?
It should be noted that the prior move to the upside is a five waves structure, an impulsive move, and therefore the correction here should only be a b wave of a zigzag, meaning we are looking for a five waves structure to come after the wedge is broken.
Our plan for trading the pattern assumes three different steps:
1. Buy every dip below 0.8800 with stop loss 0.8600 area and targeting parity. Why parity? Well, like mentioned above, terminal impulsive moves are completely retraced and this one to the downside started at 0.9970, so this is where we’re heading.
2. Buy a break of the 2-4 trend line for 0.9242 take profit and a stop loss 0.8835 This is just an intermediary trade, designed to catch the end of the first wave to the upside (we need a five waves structure to the upside remember?)
3. Buy a break of 0.9542 for 0.9970 take profit (or parity) with a stop loss 0.9320 area for this trade. This is designed to be the third wave up in that impulsive move so after the trade is filled, there should be little or no pullbacks as third waves in an impulsive move are impulsive as well.
GBPUSD Setup Targets Key Support- Scalp Bias Constructive Above 1.6469
Talking Points
- GBPUSD responds to key support
- Weekly opening rang break shifts scalp bias to the long-side
- Event risk on tap from UK & US over next 48-hours
GBPUSD Daily Chart

Chart Created Using FXCM Marketscope 2.0
Technical Outlook
- GBPUSD Rebounds off key support range 1.6469/99- Bullish invalidation
- Continuing to hold within confines of broader ascending channel off Nov low
- Weekly opening range break shifts immediate focus to the topside
- Resistance objectives at 1.6622, 1.6660/64 (Last week’s High) & 1.6722/54
- Break/close sub 1.6469 eyes support targets at 1.6428 & 1.6347/65
- Daily RSI quickly recovers sub-40 break- Constructive
- Event Risk Ahead: UK Retail Sales & US GDP tomorrow, UK GDP & University of Michigan Confidence on Friday.
GBPUSD Scalp Chart

Notes: Early this month our bias on the pound shifted to the short-side after the pair failed to close above key resistance at 1.6754 on four separate attempts. We noted that, “Our
immediate focus is against the 1.6754/58 resistance level which comes
in just above the weekly high with a move/close below the 1.6653/58
support structure shifting our bias to the short side. Such a scenario
would suggest that a more significant correction off the February high
is under way.”
The break took sterling into key support which is
defined by channel support dating back to the November low, the 100%
extension off the monthly high and the 61.8% retracement taken from the
advance off the February low. While it’s too soon to tell whether the
recent rebound completes the correction off the early high, a weekly
opening range break to the topside now aligns our longer-term and
near-term biases.
Bottom line: We’ll favor buy dips / breaks of
resistance while above 1.6535 with only a move/close sub-1.6469 shifting
our focus back to the downside. Use caution ahead of the upcoming event
risk from both the US and the UK over the next 48hours with the
releases likely to fuel added volatile in the pair. Follow the progress
of this trade setup and more throughout the trading week with DailyFX on Demand.
* It’s extremely important to give added consideration regarding the timing of intra-day scalps with the opening ranges on a session & hourly basis offering further clarity on intra-day biases.
Key Threshold Grid
Entry/Exit Targets
|
Timeframe
|
Level
|
Significance
|
Bearish Invalidation
|
30min
|
1.6583
|
38.2% Retracement / Feb 24th Low
|
Break Target 1
|
30min
|
1.6622
|
50% Retracement
|
Break Target 2
|
Daily / 30min
|
1.6660/63
|
61.8% Retracement / March 3rd Close
|
Break Target 3
|
30min
|
1.6711/15
|
78.6% Retracement / Feb 17th Close
|
Break Target 4
|
Daily / 30min
|
1.6747/54
|
61.8% Ext(s)
|
Break Target 5
|
Daily
|
1.6877/90
|
Nov 09’ High / 78.6% Fib Extension
|
Support Target 1
|
30min
|
1.6536
|
Weekly ORH / 23.6% Retracement
|
Support Target 2
|
30min
|
1.6510
|
Soft Support / Pivot
|
Bullish Invalidation
|
Daily / 30min
|
1.6469
|
61.8% Retracement
|
Break Target 1
|
Daily / 30min
|
1.6426/28
|
Soft Support / Pivot / 100DMA
|
Break Target 2
|
30min
|
1.6398
|
1.618% Fib Extension
|
Break Target 3
|
Daily / 30min
|
1.6347/65
|
1.618% Ext / 23.6% Retracement
|
Daily (20)
|
75
|
Profit Targets 20-22pips
|
|
*ORH: Opening Range High
*ORL: Opening Range Low
Wednesday, March 26, 2014
Top Trade Idea For March 26th, 2014 – AUD/NZD
Earlier this month the Reserve Bank of New Zealand decided to increase the Official Cash Rate (OCR) by 25 bps to 2.75%, making it the first central bank within the G10 FX arena to raise interest rates since the global financial crisis. Ideally, such a result should have been bullish for the Kiwi (and in general it has been over the past 2 weeks), however it has been outshined by its fellow antipodean partner, the Aussie. Interestingly, a few hours after the RBNZ rate hike announcement, Australia’s February Employment report was released and it was a bombshell – Employment change: +47.3K vs. expected +15K & Jan. was revised higher from -3.7K to 18.0K, and the Unemployment rate remained at 6.0% even though the participation rate increased to 64.8% from 64.6%. As a result, we saw AUDNZD put in a potential double bottom around 1.0540/50 and it has continued to rally over the past week.
Technically, AUDNZD appears to be in wave-c of an overall Elliot Wave a-b-c correction back higher. Overnight, the pair broke above the key 1.0705/10 level, which saw the convergence of longer-term trendline resistance drawn from the October high and the 50-day sma. Should this upward momentum continue, as daily RSI suggests since it has already broken above its corresponding March high in advance to price, then keep an eye on 1.0760/70 (Mar. high, daily Ichimoku Cloud top & 23.6% retracement), followed by 1.0855 (100-day sma) and then 1.0940/45 (2014 high & 38.2% retracement) over the ensuing days/weeks. That being said, daily RSI is nearing the key 60/65 zone once again, which is often characteristic of where bears may look to reenter the market, however a break above this level would signal a renewed uptrend in price.
Economic data & events which may influence AUDNZD through next week:
• NZ Feb. Trade Balance
• RBNZ Deputy Governor Spencer speaks
• NZ Feb. Building Permits
• AU Mar. Securities Inflation
• AU Feb. New Home Sales
• AU Feb. Private Sector Credit
• NZ Mar. Business Confidence
• NZ Feb. M3 Money Supply
• AU Mar. Manufacturing PMI
• RBA Interest Rate decision
• NZ Mar. Commodity Price Index
• AU Feb. Building Approvals
• AU Mar. Services PMI
• AU March Trade Balance
• AU March Retail Sales
• RBA Governor Stevens speaks

AUDNZD proprietary fair valuation model takes into account:
AUDNZD’s 1-year at-the-money option volatility
Equity spread between Australia’s ASX 200 & New Zealand’s NZX 50
5-year interest rate differential between Australia & New Zealand
This produces an R2 of 0.8141 since the beginning of March 2013 and implies a “fair value” of 1.0975.

Technically, AUDNZD appears to be in wave-c of an overall Elliot Wave a-b-c correction back higher. Overnight, the pair broke above the key 1.0705/10 level, which saw the convergence of longer-term trendline resistance drawn from the October high and the 50-day sma. Should this upward momentum continue, as daily RSI suggests since it has already broken above its corresponding March high in advance to price, then keep an eye on 1.0760/70 (Mar. high, daily Ichimoku Cloud top & 23.6% retracement), followed by 1.0855 (100-day sma) and then 1.0940/45 (2014 high & 38.2% retracement) over the ensuing days/weeks. That being said, daily RSI is nearing the key 60/65 zone once again, which is often characteristic of where bears may look to reenter the market, however a break above this level would signal a renewed uptrend in price.
Economic data & events which may influence AUDNZD through next week:
• NZ Feb. Trade Balance
• RBNZ Deputy Governor Spencer speaks
• NZ Feb. Building Permits
• AU Mar. Securities Inflation
• AU Feb. New Home Sales
• AU Feb. Private Sector Credit
• NZ Mar. Business Confidence
• NZ Feb. M3 Money Supply
• AU Mar. Manufacturing PMI
• RBA Interest Rate decision
• NZ Mar. Commodity Price Index
• AU Feb. Building Approvals
• AU Mar. Services PMI
• AU March Trade Balance
• AU March Retail Sales
• RBA Governor Stevens speaks
Additionally, with the potential to see a further recovery, we decided to put our proprietary model to the test.
AUDNZD proprietary fair valuation model takes into account:
AUDNZD’s 1-year at-the-money option volatility
Equity spread between Australia’s ASX 200 & New Zealand’s NZX 50
5-year interest rate differential between Australia & New Zealand
This produces an R2 of 0.8141 since the beginning of March 2013 and implies a “fair value” of 1.0975.
AUDUSD – Broke above trendline resistance & 200-day sma, but our bias is more cautious
A month ago we highlighted two technical outlooks for AUDUSD, however both suggested the Aussie could be carving out a near-term bottom. Sure enough, the pair ended up following the A-B-C corrective outlook, as AUDUSD found support shortly after testing all three of the noted bullets at the beginning of March:
- 3-Wave correction could test 38.2% retracement near 0.892
- Length of Wave-C = Wave-A around 0.8905
- Move would terminate near prior Wave-4 low
- Daily RSI has failed repeatedly into the key 60/65 zone – Break above needed to signify renewed uptrend in price
- 13-day sma still remains far below the daily 144 & 169 ema’s – Typically a bearish indication
Key Australian events which may influence AUDUSD over next few hours:
- 18:30 ET – RBA Deputy Governor Lowe speaks
- 20:30 ET – RBA Financial Stability Review
- 23:30 ET – RBA Governor Stevens speaks

Chart Source: Forex Charts by eSignal
Tuesday, March 25, 2014
Dollar to Rise if Durables Data Reinforces Fed Taper Continuity
Talking Points:
- US Consumer Confidence Jump Inspires Risk-On Mood in Asian Trade
- New Zealand Dollar Leverages Rates Outlook to Outperform Overnight
- Upbeat Durable Goods Orders to Bolster Fed “Taper” Bets, Boost USD
The absence of significant headline event risk left currency markets in consolidation mode overnight. The New Zealand Dollar
narrowly outperformed, rising as much as 0.2 percent on average against
its leading counterparts. The move tracked a rally on Asian stock
exchanges, hinting the currency was able to leverage its supportive
monetary policy outlook to capture a broader swell in risk appetite.
The MSCI Asia Pacific regional benchmark equities index rose 0.6 percent on chipper overseas demand bets after the US Consumer Confidence
index unexpectedly printed at a six-year high. The RBNZ is seen hiking
interest rates by 120 basis points over the coming 12 months according
to a measure of priced-in expectations tracked by Credit Suisse, making
the most attractive profile for yield-seeking investors in the G10 FX
space.
An uneventful data docket in European trading hours is likely to see traders looking ahead February’s US Durable Goods Orders
report. Expectations point to a 0.8 percent increase, which would
amount to the largest increase in three months. A supportive outcome is
likely to further erode doubts about continued “tapering” of Fed QE
asset purchases in the months ahead, bolstering the US Dollar. We have entered long USDCAD.
Subscribe to:
Comments (Atom)